X-ray not logging stack trace for .Net Exception
Hi Team,
Based on this post, the stack trace for .Net exception should have been captured but we are still not seeing it being carried over to X-Ray in latest ADOT collector(v0.21.0) . Can you take a look? Here is what shows in ADOT logs:
Events:
SpanEvent #0
     -> Name: exception
     -> Timestamp: 2022-09-08 17:49:41.4680647 +0000 UTC
     -> DroppedAttributesCount: 0
     -> Attributes:
         -> exception.type: STRING(PatientSecure.Grpc.SampleApi.Services.Exceptions.BookNotFoundException)
         -> exception.stacktrace: STRING(PatientSecure.Grpc.SampleApi.Services.Exceptions.BookNotFoundException: Book (90) does not exist
   at PatientSecure.Grpc.SampleApi.Services.BookService.GetBookById(Int64 id, String tenantId) in D:\Repos\ps-grpc-base-service\src\PatientSecure.Grpc.SampleApi.Services\BookService.cs:line 50
   at PatientSecure.Grpc.SampleApi.Services.v1.BooksService.GetBook(GetBookRequest request, CallContext context) in D:\Repos\ps-grpc-base-service\src\PatientSecure.Grpc.SampleApi\Services\v1\BooksService.cs:line 51
   at Grpc.Shared.Server.UnaryServerMethodInvoker`3.ResolvedInterceptorInvoker(TRequest resolvedRequest, ServerCallContext resolvedContext)
   at Grpc.Shared.Server.UnaryServerMethodInvoker`3.ResolvedInterceptorInvoker(TRequest resolvedRequest, ServerCallContext resolvedContext)
   at PatientSecure.TaskContext.Grpc.Server.TaskContextExtractor.UnaryServerHandler[TRequest,TResponse](TRequest request, ServerCallContext context, UnaryServerMethod`2 continuation)
   at Grpc.Shared.Server.InterceptorPipelineBuilder`2.<>c__DisplayClass5_0.<<UnaryPipeline>b__1>d.MoveNext()
--- End of stack trace from previous location ---
   at Grpc.Shared.Server.InterceptorPipelineBuilder`2.<>c__DisplayClass5_0.<<UnaryPipeline>b__1>d.MoveNext()
--- End of stack trace from previous location ---
   at PatientSecure.ErrorHandling.Grpc.GrpcErrorHandlerInterceptor.UnaryServerHandler[TRequest,TResponse](TRequest request, ServerCallContext context, UnaryServerMethod`2 continuation))
         -> exception.message: STRING(Book (90) does not exist)
Here is what's captured in AWS X-ray:
                "cause": {
                    "exceptions": [
                        {
                            "id": "ec42b2511609f6c5",
                            "message": "Book (90) does not exist",
                            "type": "PatientSecure.Grpc.SampleApi.Services.Exceptions.BookNotFoundException"
                        }
                    ]
                }
Hi @rui-wang-imprivata
Since none of the lines from the stack trace are showing up in the exception, I believe this line in the stack trace translation could be the reason. If your stack trace lines are not beginning with \tat (which I can't tell from the above ADOT logs), then the line will be skipped.
Can you provide the encoded string form of the stack trace from your application or collector so that we can check?
Hi @srprash , I'm not quite sure how to get the encoded string form as it comes from the .Net exception object. We didn't do any customization for the stack trace format. But I created a test .Net Core API application for demoing the issue, feel free to download it here and run in visual studio. It will throw an exception and record the exception to AWS x-Ray if you have a local collector deployed at localhost:4317.
The exception is a very basic .Net exception. It's thrown here and gets caught in controller here
On ADOT logs, it does show the stacktrace
Events:
SpanEvent #0
     -> Name: exception
     -> Timestamp: 2022-09-22 18:51:21.8477094 +0000 UTC
     -> DroppedAttributesCount: 0
     -> Attributes:
         -> exception.type: STRING(System.Exception)
         -> exception.stacktrace: STRING(System.Exception: Error happened when get weatherforecasts
   at TestAppApi.Services.ForecastService.GetWeatherForecasts() in D:\Repos\test-app\TestAppApi\Services\ForecastService.cs:line 7
   at TestAppApi.Controllers.WeatherForecastController.Get() in D:\Repos\test-app\TestAppApi\Controllers\WeatherForecastController.cs:line 31)
         -> exception.message: STRING(Error happened when get weatherforecasts)
However, on AWS X-ray, only the message gets displayed, no stack trace
"cause": {
                    "exceptions": [
                        {
                            "id": "36b2c0d76e20aea8",
                            "message": "Error happened when get weatherforecasts",
                            "type": "System.Exception"
                        }
                    ]
                }
Hi @rui-wang-imprivata , Thanks for providing the repro code. I was able to see for myself that indeed the stacktrace isn't populating in the exported segment.
And I was also able to confirm my suspicion about the lines in stacktrace not beginning with \t as this code incorrectly assumes.
Upon putting some breakpoints to analyze the Activity, I found that the .net stacktrace starts with at (3 whitespaces) rather than a tab!
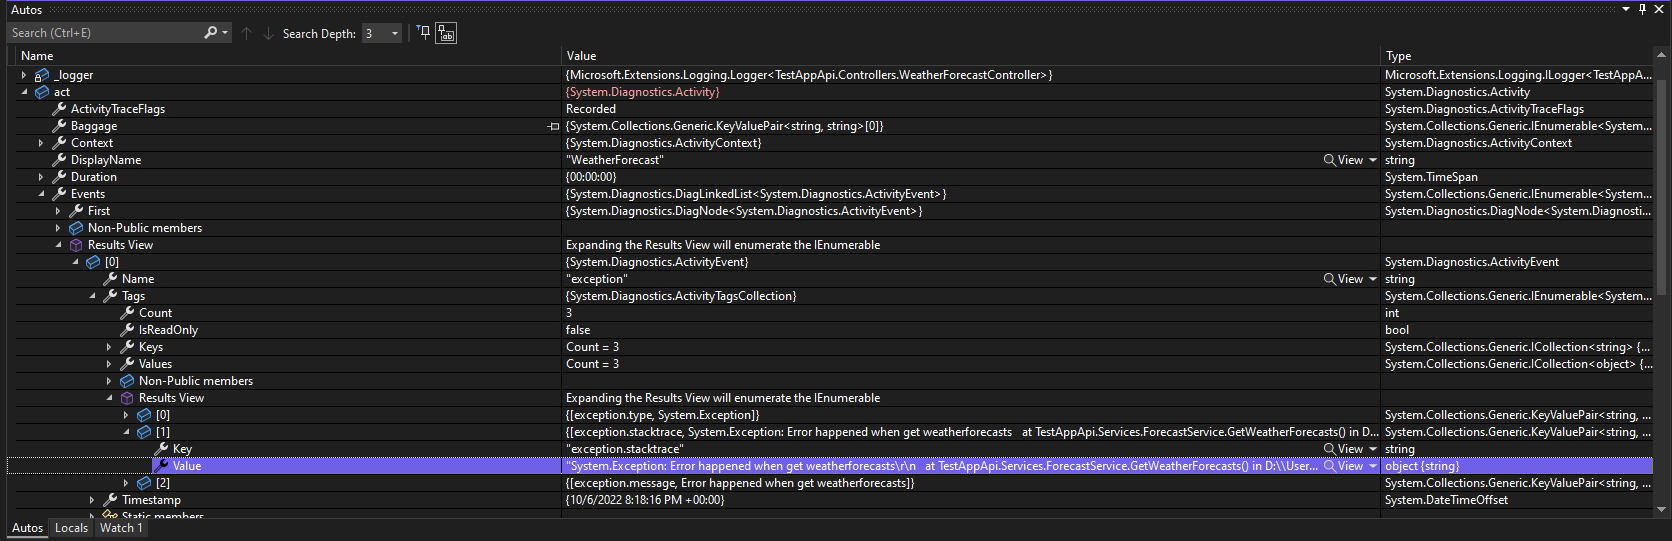
The full stacktrace string is "System.Exception: Error happened when get weatherforecasts\r\n at TestAppApi.Services.ForecastService.GetWeatherForecasts() in D:\\Users\\srprash\\Desktop\\collector_stacktrace_issue\\test-app\\TestAppApi\\Services\\ForecastService.cs:line 7\r\n at TestAppApi.Controllers.WeatherForecastController.Get() in D:\\Users\\srprash\\Desktop\\collector_stacktrace_issue\\test-app\\TestAppApi\\Controllers\\WeatherForecastController.cs:line 31"
Upon pasting this string into the unit test for dotnet stacktrace translation, it did not get translated into the actual stacktrace.
In summary, we need to update this code to not check for stacktrace lines to begin with a tab. I will create a PR to fix it.
Once again, thanks for bringing the issue to our notice. 🙂
Closed via https://github.com/open-telemetry/opentelemetry-collector-contrib/pull/14779