Thomas Robitaille
Thomas Robitaille
The https://github.com/spacetelescope/jdaviz package contains a framework for creating pure-GUI applications (or application-like objects that can be embedded in notebooks) around glue-jupyter based on YAML configuration files and the creation of...
In #166 I fixed issues relating to removing data from the bqplot viewers. We should make sure that there are no similar issues for the ipyvolume viewers.

Currently the Matplotlib image viewer uses WCSAxes to display world coordinates. There are two parts to this: * [ ] Generalize some of the code in WCSAxes in Astropy to...
Once https://github.com/glue-viz/glue/issues/2092 is implemented in glue-core we should update the image viewer options here to reflect those changes.
When using glue-jupyter in Jupyter Lab, it looks like the ipyvolume widgets are pixellated when viewed on a HiDPI display: 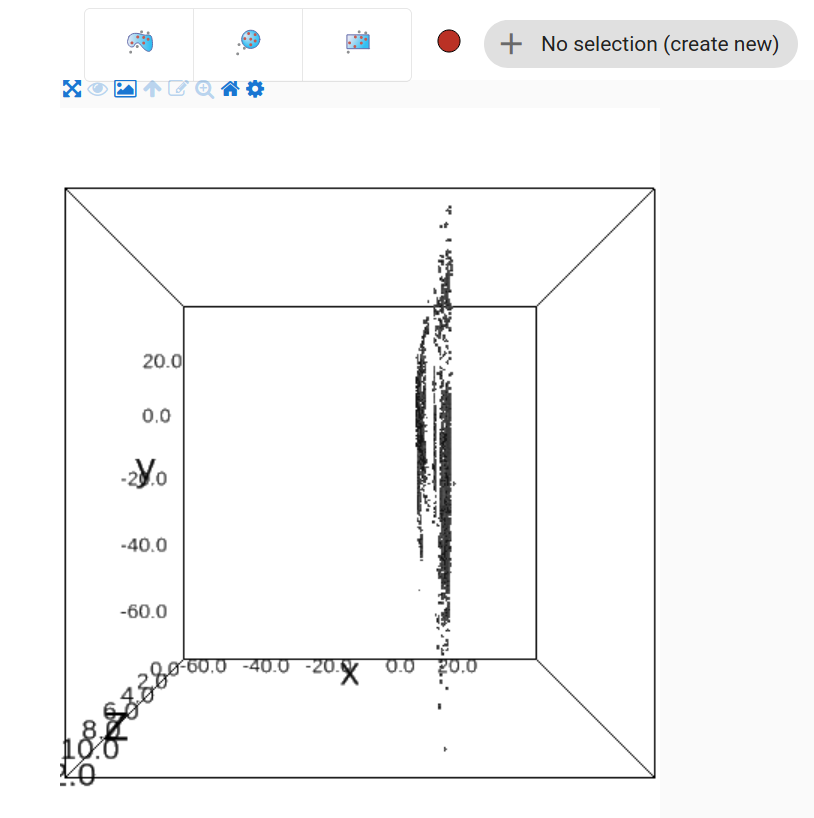 (this can be seen compared to...
At the moment, we don't do a good job of resizing plots when splitting output cells off into Jupyter Lab tabs: 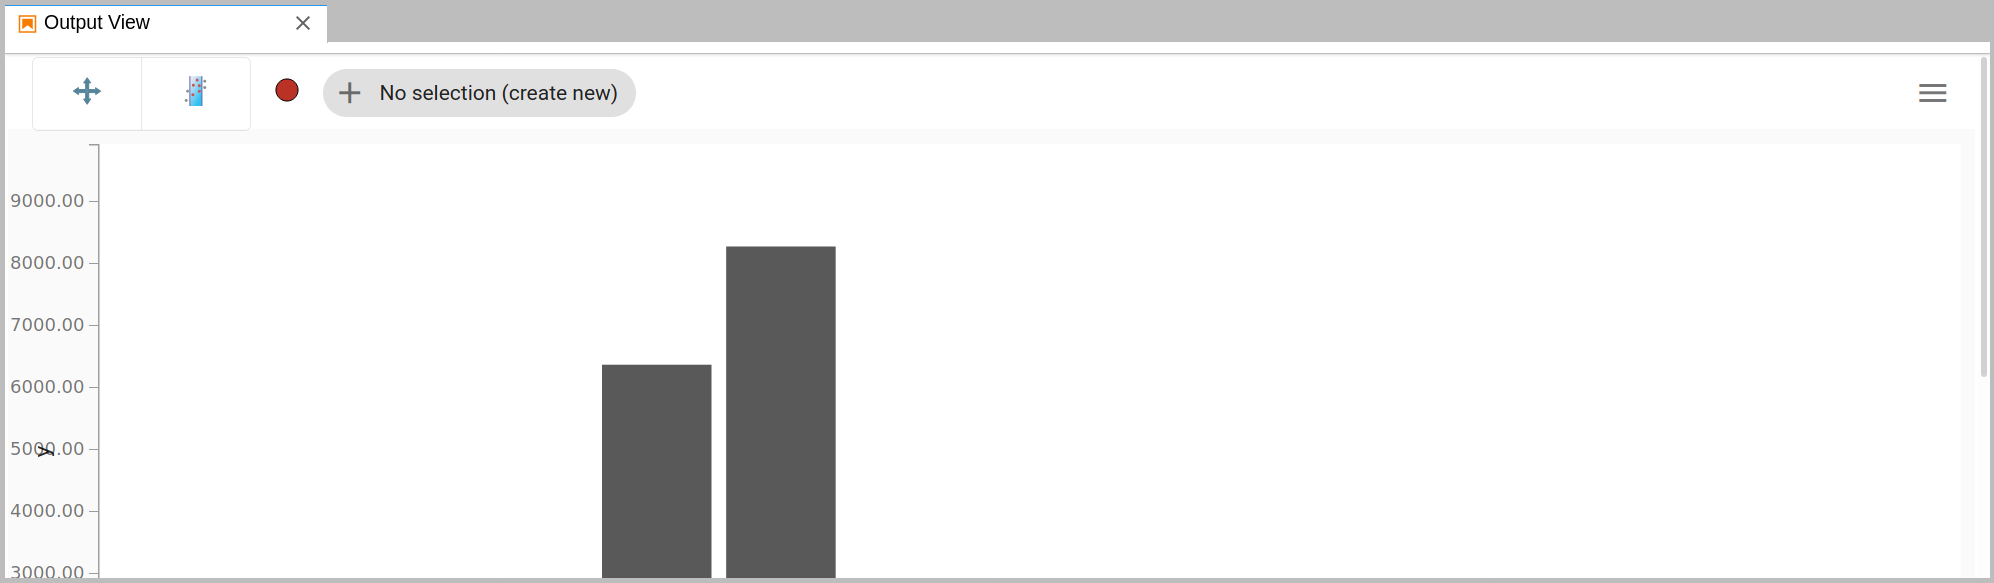 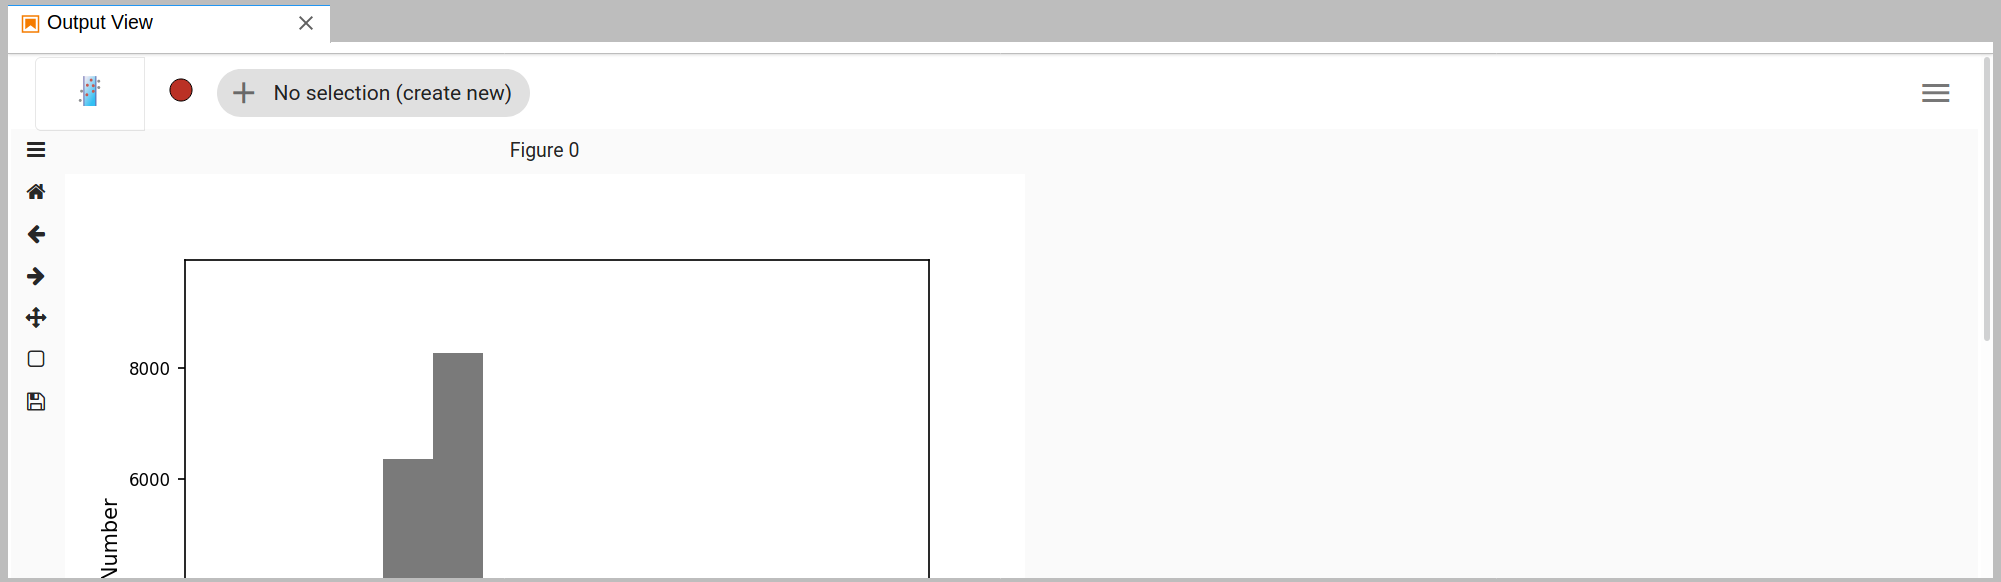 ![Screenshot...
If I run the example planes notebook and split off the output cell for the 3-d scatter plot, when panning/zooming the two views are in sync except that the two...
In the Qt image viewer, we show the tick values and the axis labels based on the coordinate system, using WCSAxes. It would be worth investigating whether we can have...
Currently this checkbox doesn't actually do anything for Matplotlib viewers, only bqplot.