dynamo-release
 dynamo-release copied to clipboard
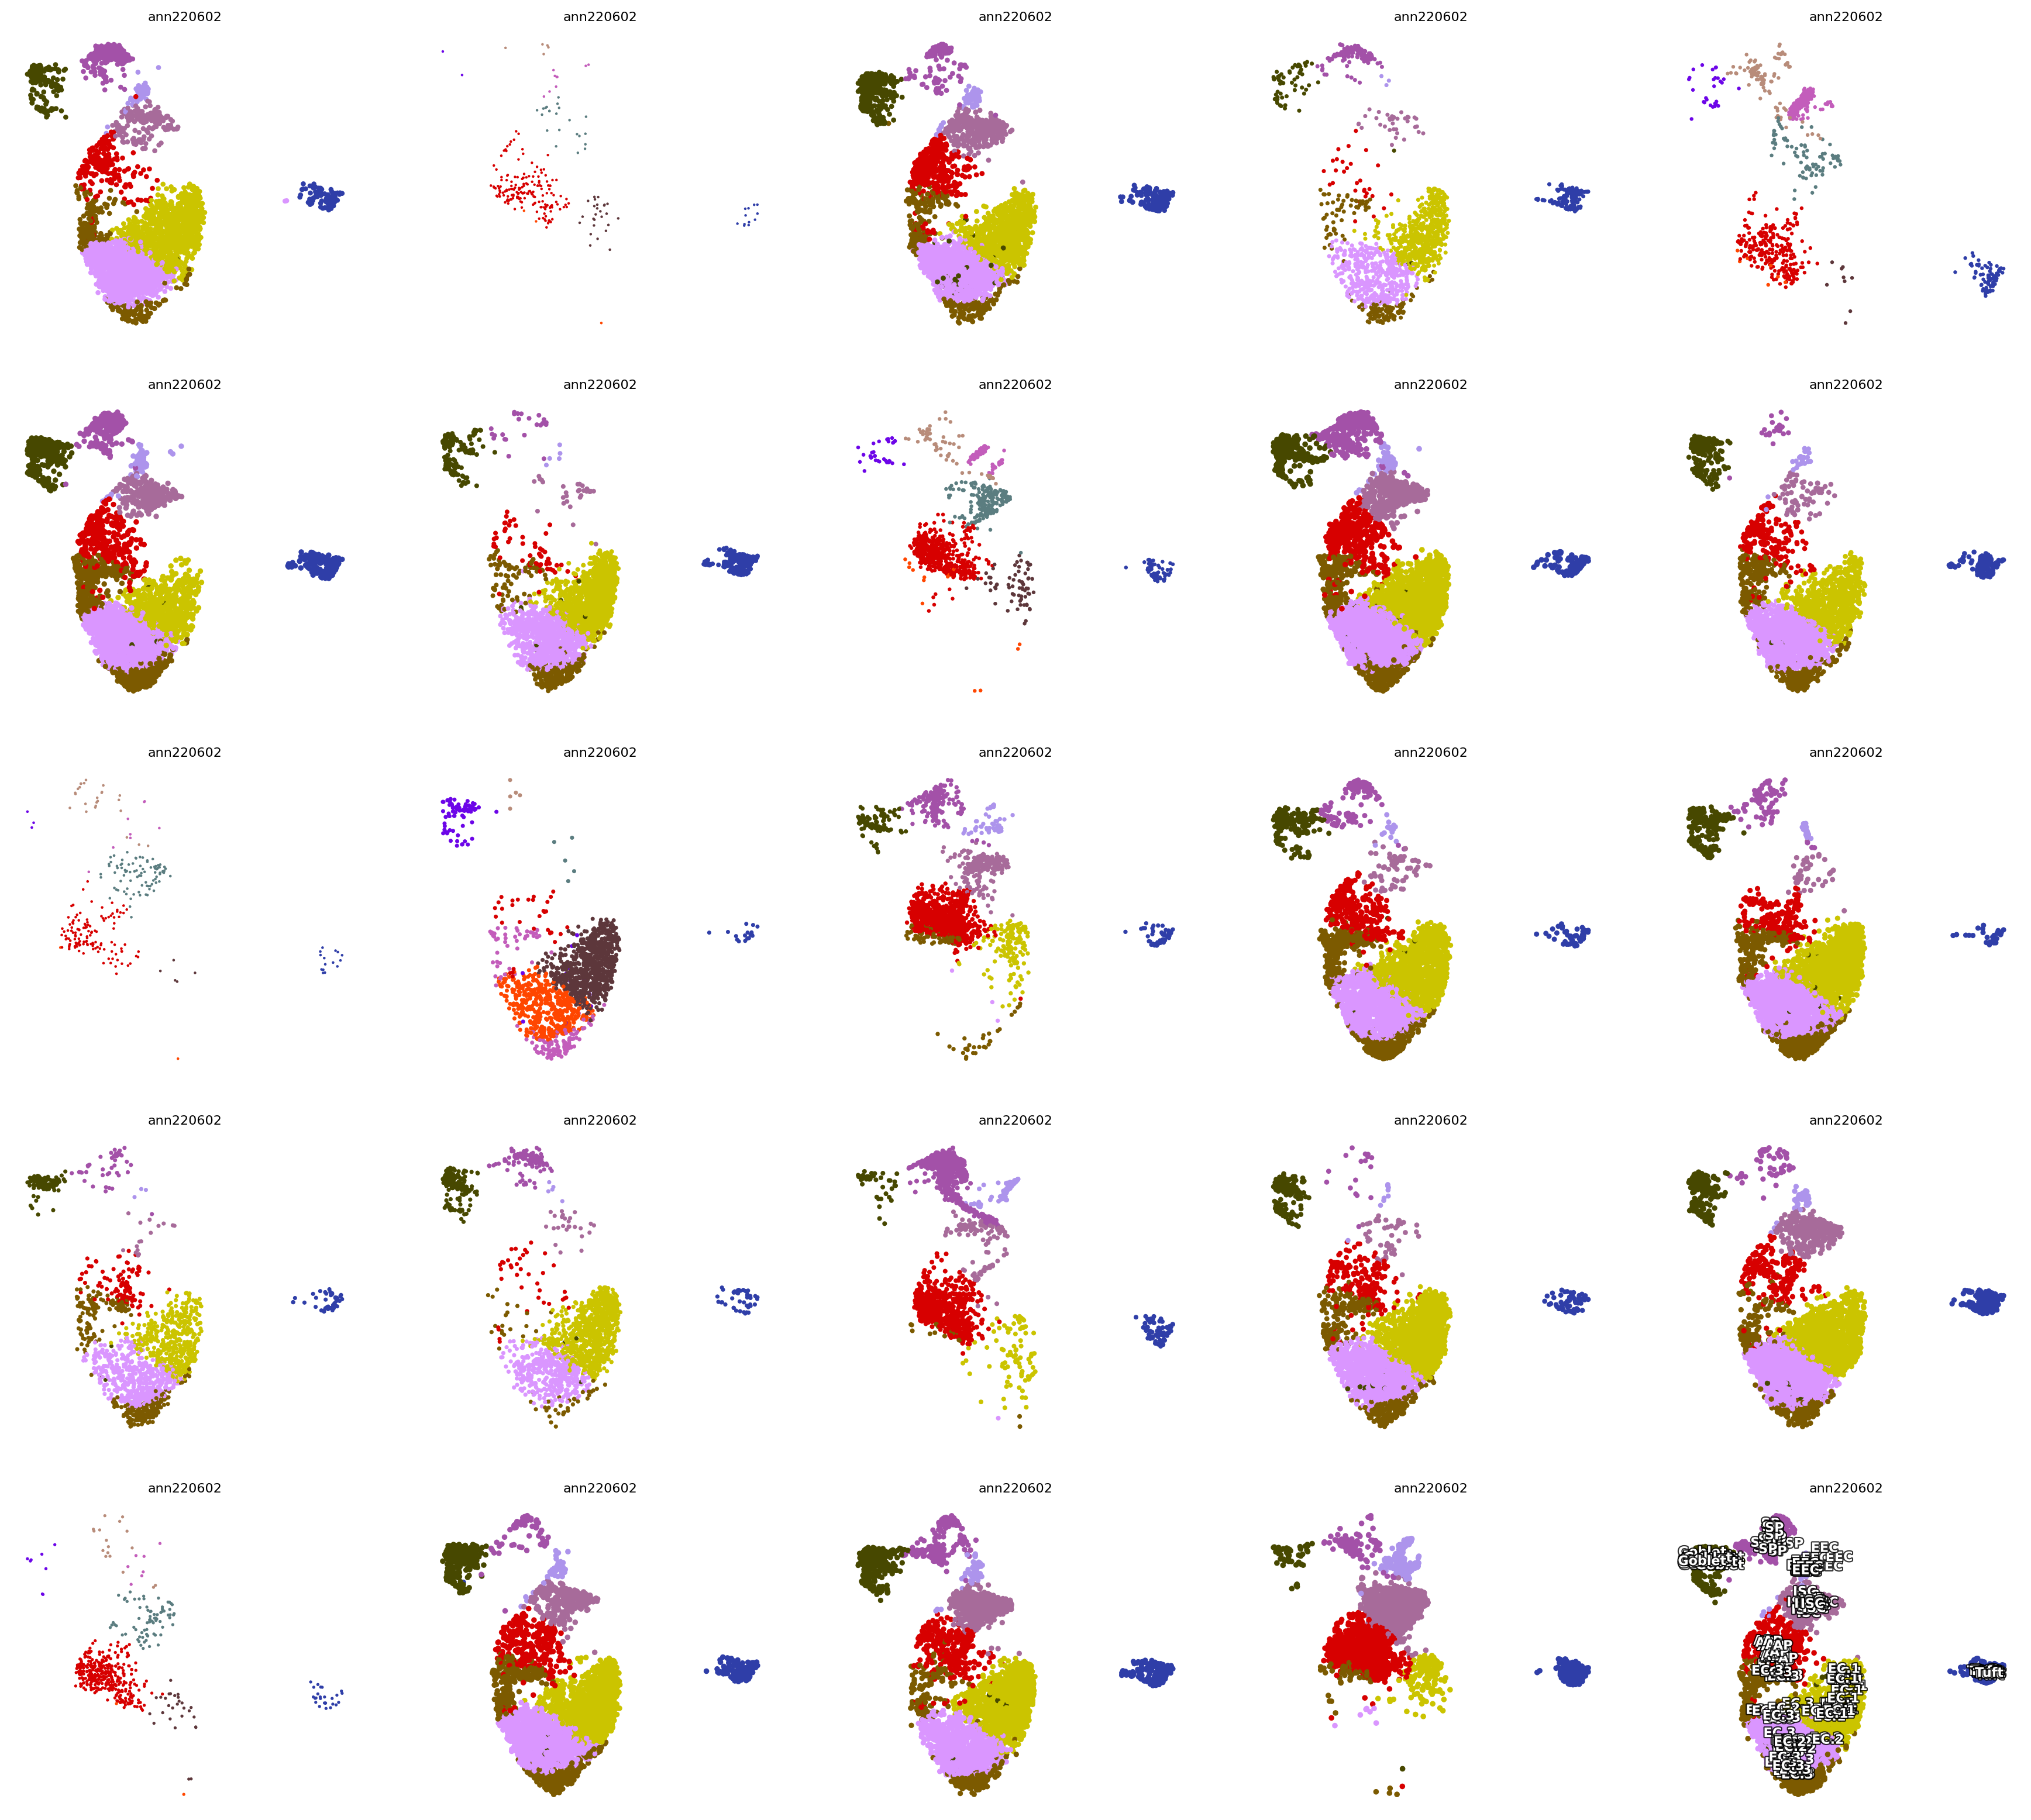
`dyn.pl.scatters` legends crowd together in the last figure when "ax" specified and show_legend='on data'
- [x] I am sure this issue is not simply a general python programming problem (if so, please google the answers).
- [x] I have searched github issues and confirm this issue has not reported previously.
- [x] I have confirmed this bug is not related to dynamo version and it exists on the latest version of dynamo.
** If this is a question and not a bug report or enhancement request, please post to our Github Discussions channel at https://github.com/aristoteleo/dynamo-release/discussions**
Describe the bug I have been using dynamo to creates a grid of scatter plots while having the following problem. dyn.pl.scatters can't display legends properly when show_legend="on data"
BTW, It is normal when show_legend="right margin".
To Reproduce The code that produced the bug:
import matplotlib.pyplot as plt
loom_dict = { this is a dict of adata objects }
fig, axs = plt.subplots(ncols=5, nrows=5, figsize=(22, 20), constrained_layout=True)
for row in range(5):
    for col in range(5):
        idx=row*5+col
        sample_name = list( loom_dict.keys())[idx]
        ldata = loom_dict[sample_name]
        dyn.pl.scatters(ldata, color='ann220602',basis='X_umap_harmony_theta0.5',
                        show_legend='on data',
                        pointsize=ldata.shape[0]/100000, alpha=1,
                        save_show_or_return='return',ax=axs[row, col]
                        )
Minimal data may be provided to reproduce the bug Traceback Not available. Behavior bug.
Expected behavior The legends should display inside each panel, instead of crowding in the last panel
Screenshots
session_info.show():
Install session-info via pip install session-info and post the output after running session_info.show()
Click to view session information
-----
anndata             0.7.5
dynamo              1.0.9
matplotlib          3.4.3
numpy               1.21.2
pandas              1.3.1
scanpy              1.9.1
scvelo              0.2.4
session_info        1.0.0
tqdm                4.62.1
-----
Click to view modules imported as dependencies
-----
IPython             7.26.0
jupyter_client      6.1.12
jupyter_core        4.7.1
notebook            6.4.12
-----
Python 3.7.12 | packaged by conda-forge | (default, Oct 26 2021, 06:08:53) [GCC 9.4.0]
Linux-5.13.0-52-generic-x86_64-with-debian-bullseye-sid
-----
Session information updated at 2022-08-30 15:44
Additional context Add any other context about the problem here.
NA
Thanks for reporting this bug @chansigit! I have confirmed this is indeed a bug in dynamo. We will take time to fix this bug ASAP
My latest commit should fix this bug. please let me know if you have any additional questions
Actually, I was wondering if the same thing happened in other visualization tools of dynamo. I met the same issues in dyn.pl.cell_velocities() and dyn.pl.streamline_plot(). There were no legends displayed at all when show_legend="on data". Have this problem been solved in a new version of dynamo?
It should have fixed the issue. Please pull the latest changes and reinstall dynamo again
This issue is stale because it has been open 90 days with no activity. Remove stale label or comment or this will be closed in 14 days
Hi, I am using dynamo 1.2.0. dyn.pl.scatters don't show y-axis and x-axis. How to add them (especially y-axis, which is the gene expression) ? Then I can know the gene expression lelvel from y-axis.