dynamo-release
 dynamo-release copied to clipboard
Issue with dyn.tl.dynamics(adata)
Hello dynamo, I ran into this problem when trying to run our dataset. What do you suggest? thank you very much. My code process is as follows,
import warnings warnings.filterwarnings('ignore') import dynamo as dyn dyn.dynamo_logger.main_silence()
adata = dyn.read_h5ad(r"E:\python\h5ad\a.h5ad") dyn.pp.recipe_monocle(adata) dyn.tl.dynamics(adata) dyn.vf.VectorField(adata, basis='umap') gene = "A2M" dyn.pd.perturbation(adata, gene, [-100], emb_basis="umap") dyn.pl.streamline_plot(adata, color=["cell_type", gene], basis="umap_perturbation")
The following problems occur,
Since dyn.pl.phase_diagram in dynamo by default colors cells by its cell-cycle stage,
you need to set color argument accordingly if confronting errors related to this.
|-----> [recipe_monocle preprocess] in progress: 100.0000%
|-----> [recipe_monocle preprocess] finished [3.4008s]
|-----> calculating first/second moments...
|-----> [moments calculation] in progress: 100.0000%
|-----> [moments calculation] finished [9.6158s]
Traceback (most recent call last):
File "E:/python/test_dynamo_2.py", line 11, in
thanks for this issue @ergezhenshuai . As I asked in the other thread, do you have spliced/unspliced layers for your adata object to start with? Dynamo will need to use these layers or the metabolic labeling data to perform velocity and vector field analyses for downstream predictions.
can you let me know what is the output after you type adata?
Thank you for your answer, the output after we input adata。
AnnData object with n_obs × n_vars = 2280 × 26154 obs: 'n_genes_by_counts', 'log1p_n_genes_by_counts', 'total_counts', 'log1p_total_counts', 'pct_counts_in_top_50_genes', 'pct_counts_in_top_100_genes', 'pct_counts_in_top_200_genes', 'pct_counts_in_top_500_genes', 'total_counts_mt', 'log1p_total_counts_mt', 'pct_counts_mt', 'leiden_2.0' var: 'mt', 'n_cells_by_counts', 'mean_counts', 'log1p_mean_counts', 'pct_dropout_by_counts', 'total_counts', 'log1p_total_counts', 'n_cells', 'mean', 'std' uns: 'leiden', 'leiden_2.0_colors', 'neighbors', 'pca', 'spatial_neighbors', 'umap' obsm: 'X_pca', 'X_umap', 'spatial' varm: 'PCs' obsp: 'connectivities', 'distances', 'spatial_connectivities', 'spatial_distances'
Output after using dyn.pp.recipe_monocle(adata),
AnnData object with n_obs × n_vars = 2280 × 26154 obs: 'n_genes_by_counts', 'log1p_n_genes_by_counts', 'total_counts', 'log1p_total_counts', 'pct_counts_in_top_50_genes', 'pct_counts_in_top_100_genes', 'pct_counts_in_top_200_genes', 'pct_counts_in_top_500_genes', 'total_counts_mt', 'log1p_total_counts_mt', 'pct_counts_mt', 'leiden_2.0', 'nGenes', 'nCounts', 'pass_basic_filter', 'Size_Factor', 'initial_cell_size' var: 'mt', 'n_cells_by_counts', 'mean_counts', 'log1p_mean_counts', 'pct_dropout_by_counts', 'total_counts', 'log1p_total_counts', 'n_cells', 'mean', 'std', 'nCells', 'nCounts', 'pass_basic_filter', 'log_cv', 'log_m', 'score', 'frac', 'use_for_pca' uns: 'leiden', 'leiden_2.0_colors', 'neighbors', 'pca', 'spatial_neighbors', 'umap', 'pp', 'velocyto_SVR', 'PCs', 'explained_variance_ratio_', 'pca_mean', 'pca_fit', 'feature_selection', 'cell_phase_genes' obsm: 'X_pca', 'X_umap', 'spatial', 'X' varm: 'PCs' obsp: 'connectivities', 'distances', 'spatial_connectivities', 'spatial_distances'
as I said, your data doesn't have spliced . and unspliced layers and only has total RNA info. you will need to first get these layers to start with. You may consider using kb-python: https://github.com/pachterlab/kb_python
Thanks for your suggestion, we processed our data to have spliced and unspliced layers. But when we used dyn.tl.cell_velocities(adata), the following error occurred:
Traceback (most recent call last):
File "E:/python/test_dynamo_2.py", line 17, in
We found that in the adata output, var does not have use_for_transition and obsm does not have velocity_pca,velocity_umap, etc.In this case, how should we handle it?
please pass transition_genes = adata.var_names[adata.var.use_for_pca] to the dyn.tl.cell_velocities function
Thank you for your answer, I have a problem, when the image is saved and displayed, the image is not the same
dyn.pd.perturbation(adata, gene, [-100], emb_basis="umap") dyn.pl.streamline_plot(adata, color=["cell_type", gene], basis="umap_perturbation", save_show_or_return="save", save_kwargs={"path": "E:\python\plot\", "prefix": 'scatter', "dpi": None, "ext": 'svg', "transparent": True, "close": True, "verbose": True})
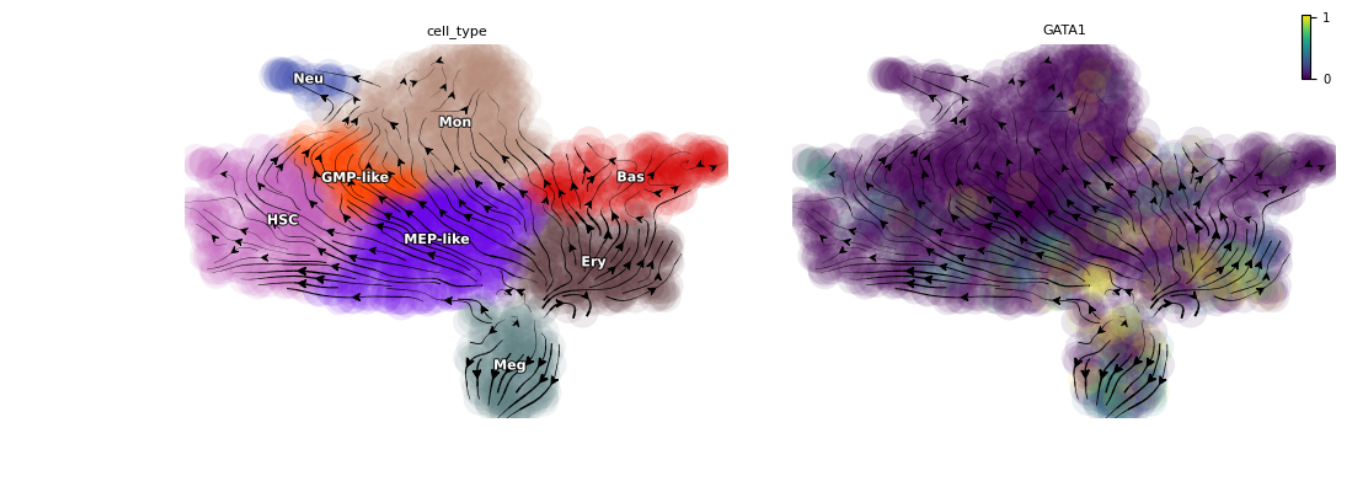
Below is when the image is showed,
Below is when the image is saved,
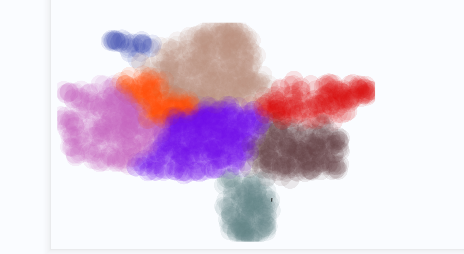 Total RNA stream line plot don't have arrows and it is missing a plot.