dynamo-release
 dynamo-release copied to clipboard
Question about rank acceleration
Hi, I have a simple questions about rank acceleration. Is abs just changing the sign? If yes, Why is BIK ahead of S100A6 in column 1 of rank_abs_acceleration as follows:
adata.uns['rank_abs_acceleration']
           0       1       2       3       4
0        BIK     BIK  TUBA1B  MALAT1   HSPA5
1      HMGB2     FOS   HMGB2     BIK   HMGB2
2     TMSB4X  S100A6    TUBB  TUBA1B  MALAT1
3       RBP1   PRDX1    TYMS    CD24   PTTG1
4       MEST    KLF4   BIRC5   HMGB2   ACTG1
...      ...     ...     ...     ...     ...
1995  CCDC32    ENSA    SIK3    SIK3  GRIN3A
1996   TANC1  POU6F2   RIMS1   CRMP1   HDAC9
1997   INTS6  CCDC32   HDAC9  GRIN3A    IQCG
1998  ADGRV1   HDAC9   PDE4D  CCDC32    RAI1
1999   HDAC9   SRSF1   CRMP1   HDAC9   TANC1

adata.uns['rank_acceleration']
           0       1       2        3       4
0      HMGB2   HMGB2    CD24   MALAT1  MALAT1
1     MALAT1   TOP2A   ASCL1    TOP2A   NEAT1
2      TOP2A    CKS2   BNIP3  C6orf48    MIAT
3       CKS2   DDIT3   RPS18    ZFAS1    CDK1
4     EIF4A2  MALAT1  RPL13A   EIF4A2    SYT1
...      ...     ...     ...      ...     ...
1995   BASP1    CD24    PCNA     RBP1    PTMS
1996    TFF3  TMSB4X    TYMS    PRDX1   UBE2S
1997    MEST    RBP1    TUBB     PCP4   ACTG1
1998    RBP1     BIK   HMGB2   TUBA1B   PTTG1
1999  TMSB4X  S100A6  TUBA1B      BIK   HSPA5
Can I get the value used by the rank, as I don't know if it is positive or negative regulation. I found the acceleration stored in adata.layers['acceleration'] (cell by gene). Are the rank acceleration ranked by the average of the same group?
Please also solve the #304, if you are free. Thanks!
Hi @lh12565 I am aware of your issues. Will find sometime later tonight to address them
Thanks again for using dynamo. I finally got some time to address your questions:
- Is abs just changing the sign? If yes, Why is BIK ahead of S100A6 in column 1 of rank_abs_acceleration as follows:
- Can I get the value used by the rank, as I don't know if it is positive or negative regulation. 3.Are the rank acceleration ranked by the average of the same group?
My answers are the following:
- yes, the
absmeans that we will first calculate the absolute value of the acceleration (convert negative values to positive values) before we rank genes. This will reveal the magnitute of RNA acceleration while ignore the direction. For your specific question regarding this two genes. I recommend you to plot the acceleration values of this two genes to reveal the acceleration values across cells:dyn.pl.scatters(adata, layer='acceleration', color=['Tmsb4x', 'Cck']) - yes, you can. Please pass the
output_values = Truetodyn.vf.rank_acceleration_genes - that is right, if you pass the cell
groupsargument, you will get the ranking for each cell group. Otherwise it will be ranked across all cells. all ranking are based on the average values.
Btw, I have updated the documentation of the dynamo in my latest commits, please git pull and setup install to see those updates. I will release a new version of dynamo in a few days to pypi.
Please see my answer to your question in the other github issue
Thanks, when I add output_values = True, I find the value of rank_acceleration or rank_abs_acceleration are different, see below, so the sorting is inconsistent for me. I don't know if that's normal.
adata.uns['rank_abs_acceleration']
           0  0_values       1      1_values  ...       3  3_values       4  4_values
0        BIK  0.000890     BIK  2.094293e-04  ...  MALAT1  0.001347   HSPA5  0.002405
1      HMGB2  0.000843     FOS  2.088793e-04  ...     BIK  0.001296   HMGB2  0.001846
2     TMSB4X  0.000821  S100A6  1.846818e-04  ...  TUBA1B  0.000940  MALAT1  0.001751
3       RBP1  0.000813   PRDX1  1.764531e-04  ...    CD24  0.000717   PTTG1  0.001726
4       MEST  0.000782    KLF4  1.518182e-04  ...   HMGB2  0.000694   ACTG1  0.001704
...      ...       ...     ...           ...  ...     ...       ...     ...       ...
1995  CCDC32  0.000004    ENSA  9.541227e-07  ...    SIK3  0.000003  GRIN3A  0.000004
1996   TANC1  0.000004  POU6F2  9.290505e-07  ...   CRMP1  0.000003   HDAC9  0.000004
1997   INTS6  0.000004  CCDC32  8.875585e-07  ...  GRIN3A  0.000003    IQCG  0.000004
1998  ADGRV1  0.000004   HDAC9  8.821968e-07  ...  CCDC32  0.000003    RAI1  0.000004
1999   HDAC9  0.000004   SRSF1  8.421325e-07  ...   HDAC9  0.000003   TANC1  0.000003

adata.uns['rank_acceleration']
           0  0_values       1  1_values  ...        3  3_values       4  4_values
0      HMGB2  0.000574   HMGB2  0.000122  ...   MALAT1  0.001086  MALAT1  0.001613
1     MALAT1  0.000513   TOP2A  0.000109  ...    TOP2A  0.000428   NEAT1  0.000807
2      TOP2A  0.000504    CKS2  0.000099  ...  C6orf48  0.000409    MIAT  0.000722
3       CKS2  0.000499   DDIT3  0.000094  ...    ZFAS1  0.000383    CDK1  0.000586
4     EIF4A2  0.000482  MALAT1  0.000093  ...   EIF4A2  0.000381    SYT1  0.000539
...      ...       ...     ...       ...  ...      ...       ...     ...       ...
1995   BASP1 -0.000604    CD24 -0.000099  ...     RBP1 -0.000550    PTMS -0.001502
1996    TFF3 -0.000605  TMSB4X -0.000103  ...    PRDX1 -0.000552   UBE2S -0.001530
1997    MEST -0.000729    RBP1 -0.000104  ...     PCP4 -0.000619   ACTG1 -0.001648
1998    RBP1 -0.000743     BIK -0.000139  ...   TUBA1B -0.000700   PTTG1 -0.001653
1999  TMSB4X -0.000786  S100A6 -0.000151  ...      BIK -0.001245   HSPA5 -0.002334
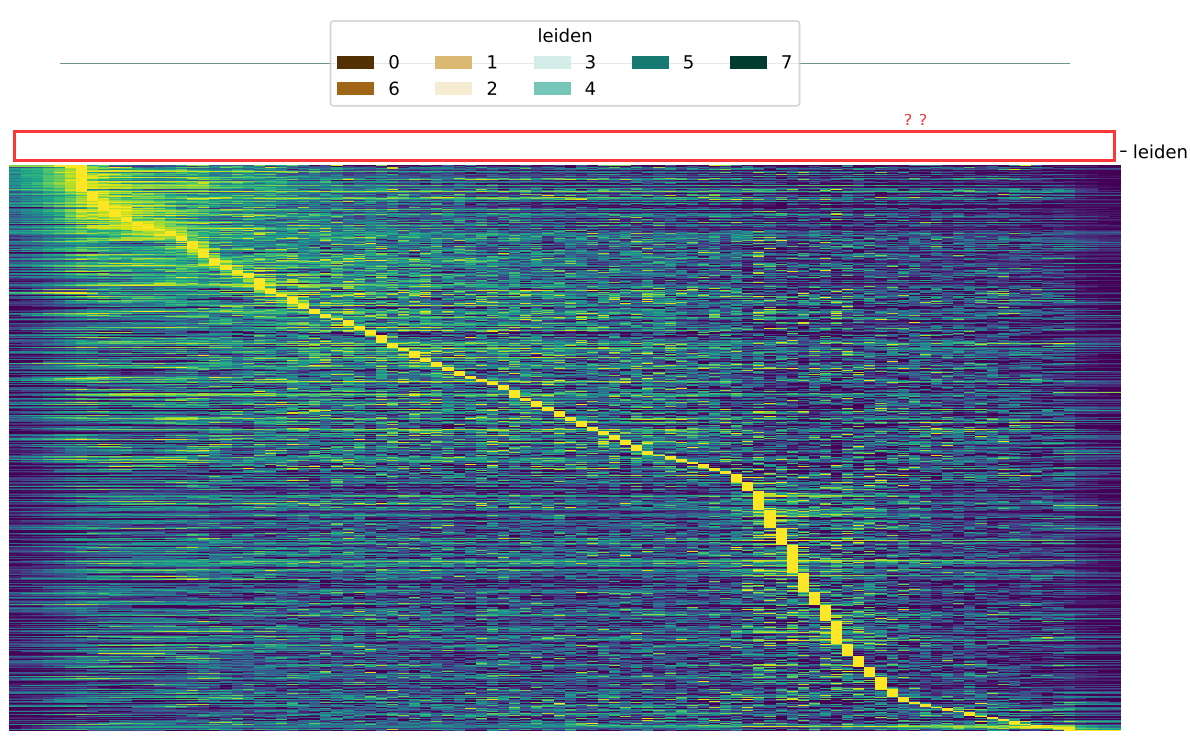
I also have a problem of downstream analysis. When I run the code as follows to visualize the bar of group, the bar did not show up:
dyn.pl.kinetic_heatmap(adata,
                       genes=transition_genes,
                       tkey='pca_ddhodge_potential',
                       gene_order_method='maximum',
                       mode='pseudotime',
                       color_map='viridis',
					   #xticklabels=True,
                       yticklabels=False,
		       cell_group='leiden',
		       cell_group_cmap='BrBG')
Dear @lh12565 , I have explained to you abs means we use the absolute value for ranking. Without abs it of course uses the raw values and that is why you can see negative values in the resultant ranking table.
regarding to the missing leiden group, that is strange because col_colors=col_colors, has passed to the clustermap function which in theory should plot the plot. Have you tried in a different dataset and tried supplied the argument cell_group_cmap with a different color map
@dummyindex could you please also take a look at this issue?
This issue is stale because it has been open 90 days with no activity. Remove stale label or comment or this will be closed in 14 days