trivy-operator
 trivy-operator copied to clipboard
Provide Grafana Dashboard for Prometheus Metrics
I was playing with the operator and couldn't find a Grafana Dashboard JSON file. As discussed in the https://github.com/aquasecurity/trivy-operator/issues/78, I just noticed this feature is very new and almost 1-week-old. https://github.com/aquasecurity/trivy-operator/pull/96/files by @erikgb
I propose we should provide a new Grafana Dashboard at Configuration section in docs. (screenshot included)
Are there any example dashboards created before? If not, I can get to it.
It would be nice to add a Grafana dashboard, at least to show users an example on how to use the metrics produced by the operator. We have a dashboard for our internal operator, that we want to replace with trivy-operator - that could be a decent starting point. @mikaello
@devopstales created three dashboards for their implementation of a trivy operator (trivy-operator); maybe they can be used as a starting point?
Screenshot:
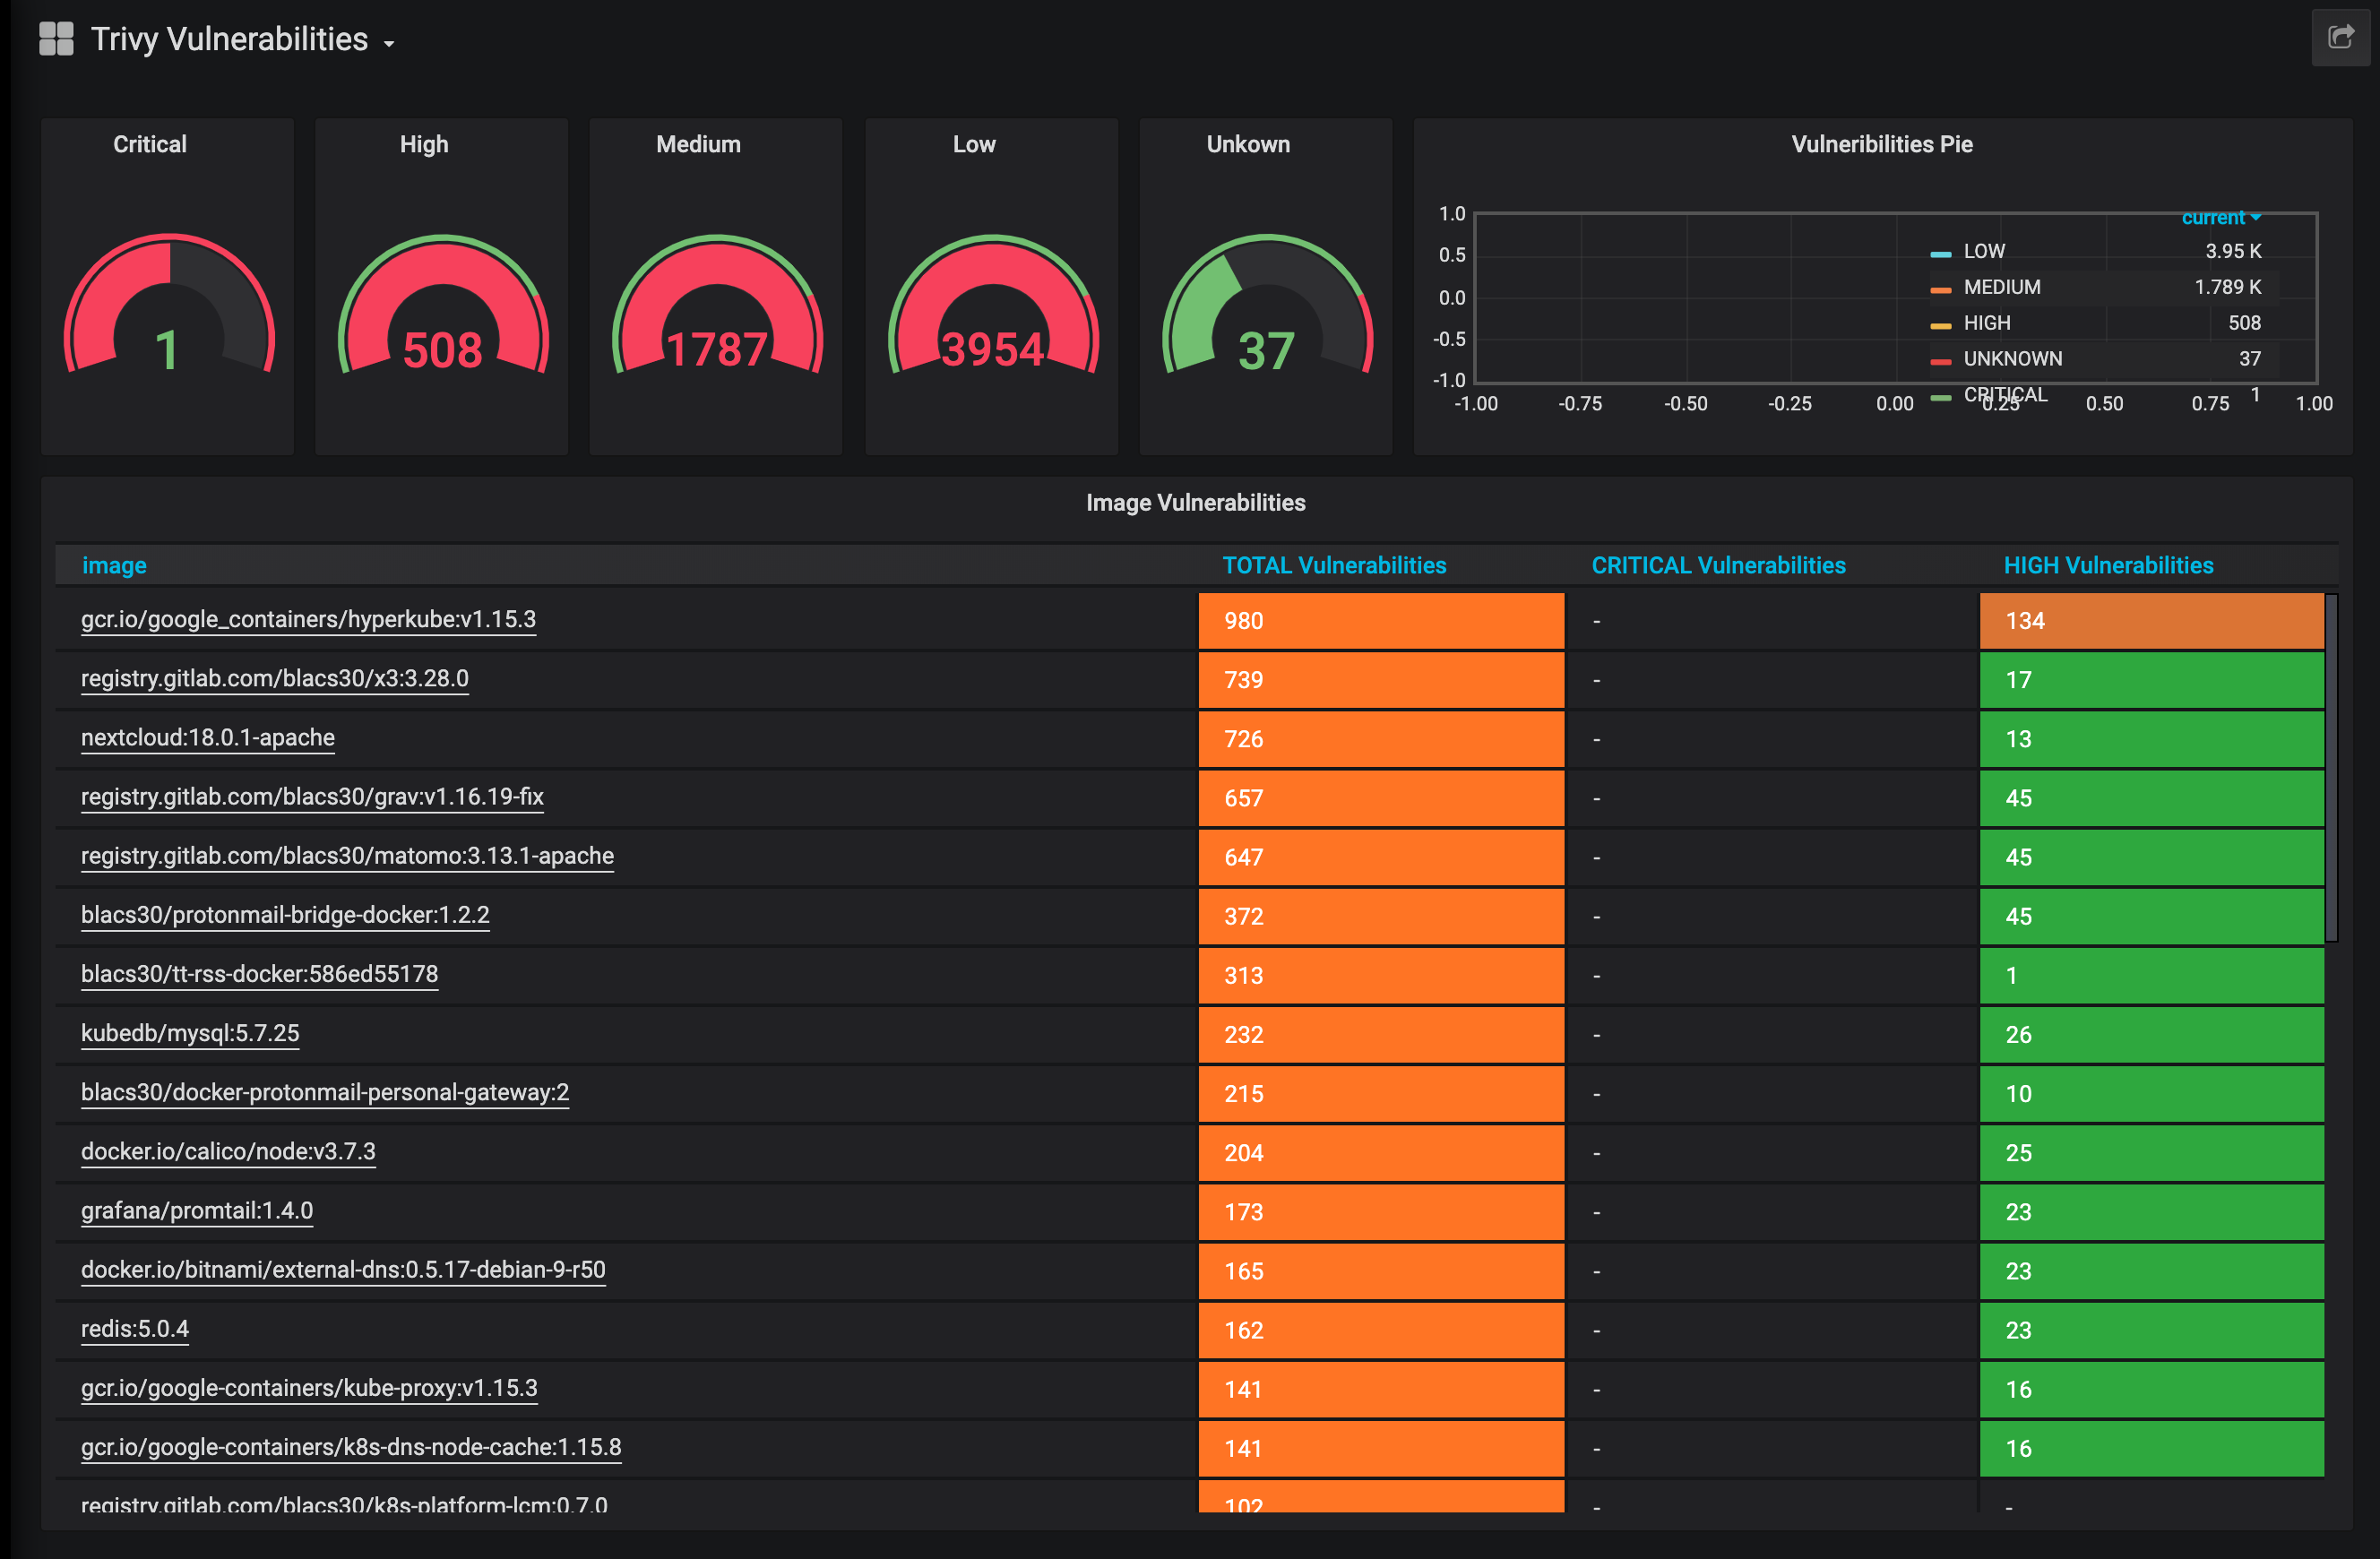
My colleague @pmarkiewka and I created a first version of a trivy op dashboard similar to the devopstales one:
 Uploading with Grafana failed, so for now the source can be found in this gist.
We're still struggling with alerting, though. Did anyone of you succeed in alerting for new CVEs?
We tried it, but ran into the issue that PromQL increase() considers creation of new timeseries as reset: prometheus/prometheus#1673. So we would miss the first CVE of each image version ☹️
Edit: Here's an example query to alert on:
increase(trivy_image_vulnerabilities{namespace="argocd-production", severity="Critical"}[5m])
BTW We shared what we learned about trivy op on myCloudogu.
Awesome news @schnatterer !
I will try your dashboard and take a look for alerting for new CVE ASAP
It would be super cool if it would be implemented as a mixin so users can customize it easily and add the library to their existing workflows.
Hello fellaz, I managed to find this one here https://grafana.com/grafana/dashboards/16337-trivy-starboard-operator-vulnerabilities/ .. Is that probably a compatible / comprehensive dashboard with the latest version of the Trivy Operator?
Unfortunately I didn't try it out just yet.
Dashboard available here.
@chen-keinan Did you mean to attach a link? "here" is just normal text.
Dashboard available here.
@chen-keinan Did you mean to attach a link? "here" is just normal text. thanks for catch up , link is updated