react-apexcharts
 react-apexcharts copied to clipboard
basic column chart - when xaxis categories updates dynamically, that's not reflected in chart
I tried using below code in my application. https://apexcharts.com/react-chart-demos/column-charts/basic/
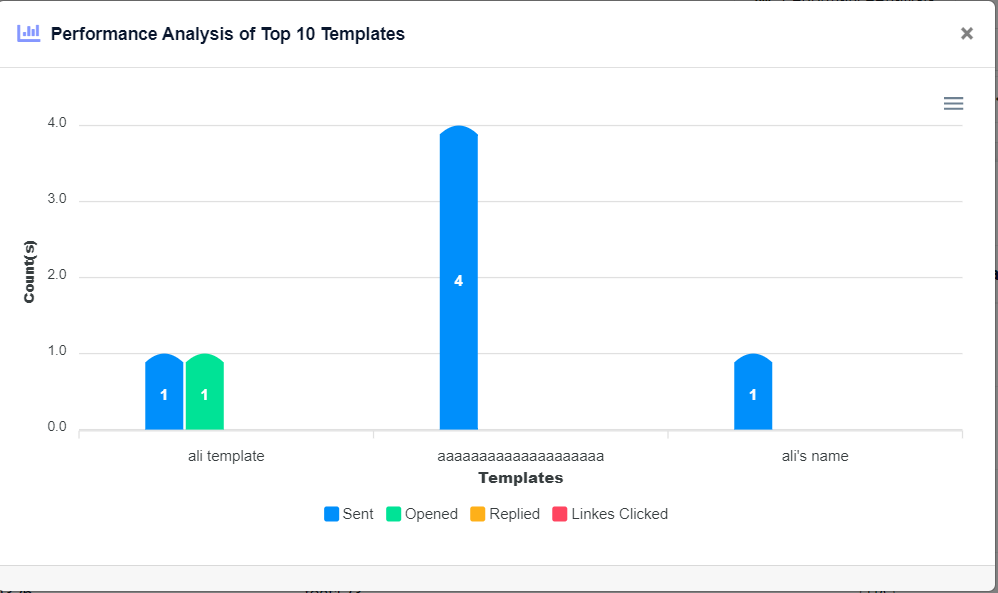
In the below graph I can see the xaxis categories updates dynamically based on data. but in graph that's not reflected.

expected outcome:
- [ ] When xaxis categories updated dynamically it should reflect in the graph
In vue, I can use updateOptions to solve the problem.
<apexchart ref="chart" type="bar" height="350" :options="chartOptions" :series="series"></apexchart>

<script>
methods:{
  change(){
    this.$refs.chart.updateOptions({
        xaxis: {
            type: 'date',
            categories: [1,2,3],
        }
    });
  }
}
</script>
In react I can use useEffect to monitor and update the state changes.
useEffect(() => {
    setState((prevState) => {
      return {
        ...prevState,
        options: {
          ...prevState.options,
          xaxis: {
            categories: templatePerformancechartData.map(
              (data) => data.emailTemplateName
            ),
            labels: {
              trim: true,
              maxHeight: 50,
            },
          },
        },
      };
    });
  }, [templatePerformancechartData]);

<ReactApexChart options={state.options} series={state.series} type="bar" height={350} />
For me (using a component class), the following works just fine. I bind a separate function to update the different properties of the chart depending on changed intervals or filters from the main App component. It can be adapted to use the function components instead.
export function updateChart(chart) {
    const series = chart.series;
    const labels = chart.labels;

    this.setState({
        series: series, // Updating with the new series
        options: {
            xaxis: {
                categories: labels // This is what is necessary to also update the categories
            }
        }
    });
}
And don't forget to bind the function in the constructor method for the chart.
updateChart = updateChart.bind(this);
So whenever I update the the date filter or any other data in my main component I just call the function and the chart is updated (both series and labels)
componentDidUpdate() {
    updateChart(this.state.charts.new_chart_data);
}
And this is the chart component itself
class ExampleChart extends React.Component {
    constructor(props) {
        super(props);

        const chart = this.props.chart;

        updateChart = updateChart.bind(this);

        this.state = {
            options: {
                chart: {
                    id: "example-chart",
                    toolbar: {
                        show: false
                    },
                },
                dataLabels: {
                    enabled: true
                },
                stroke: {
                    curve: 'smooth'
                },
                xaxis: {
                    categories: chart.labels
                }
            },
            days: this.props.days,
            series: chart.series
        };
    }

    render() {
        return (
            <div className="app">
                <div className="row">
                    <div className="mixed-chart">
                        <Chart
                            options={this.state.options}
                            series={this.state.series}
                            type={this.props.type}
                            width="100%"
                            height="400px"
                        />
                    </div>
                </div>
            </div>
        );
    }
}
I am still somewhat of a novice when it comes to React, and there are possibly better solutions. But I just wanted to add this approach since I got it working with the desired effect.