react-apexcharts
 react-apexcharts copied to clipboard
Published
20 hours ago •
 apexcharts
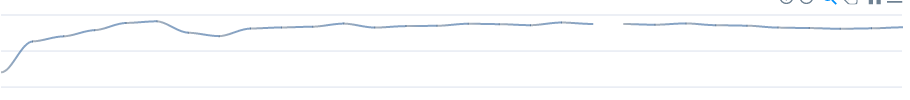
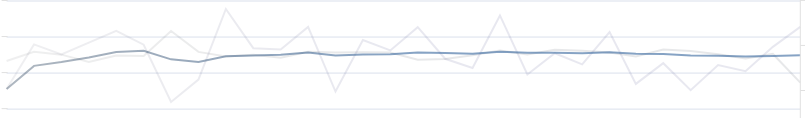
Break/gap in line chart series when consecutive points contain the same value.
Using a line chart with stroke curve set to smooth, if the series data has at least two consecutive points with the same x-axis value, the series line will display a gap/break in data. When stroke curve set to straight you will see it makes one continuous line. Both images below share the same data and configuration outside the difference in stroke curve.