apexcharts.js
 apexcharts.js copied to clipboard
Published
20 hours ago •
 apexcharts
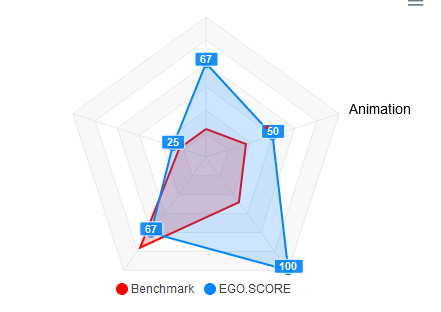
Radar Chart hides X-Axis Categories by using enabledOnSeries
Description
EnabledOnSeries doesn't just hide the dataLabels of all other Series in a Radar chart, but also hides the X-Axis Categories with the same indices.
Steps to Reproduce
- Create a chart
- set: dataLabels: { enabled: true, enabledOnSeries: [1], },
- name the x-axis categories
Expected Behavior
Just the dataLabels with the named indices are shown. All x-axis categories are shown
Actual Behavior
Just the dataLabels with the named indices are shown. Just the x-axis categories with the named indices are shown.
Screenshots
Reproduction Link
https://codepen.io/julius-mrtn/pen/XWBMdpM