apexcharts.js
 apexcharts.js copied to clipboard
Incorrect datetime label/tick position after using formatter function
Description
Steps to Reproduce
- use
xaxis.type: 'datetime'for the chart - add a
xaxis.labels.formatterfunction to customize labels
Expected Behavior
after using xaxis.labels.formatter function I expected every label of the x-axis to stay in the same place and only the text for each one of them to be calculated according to the formatter function. This is needed to use another calendar type for example Jalaali instead of the usual Gregorian calendar
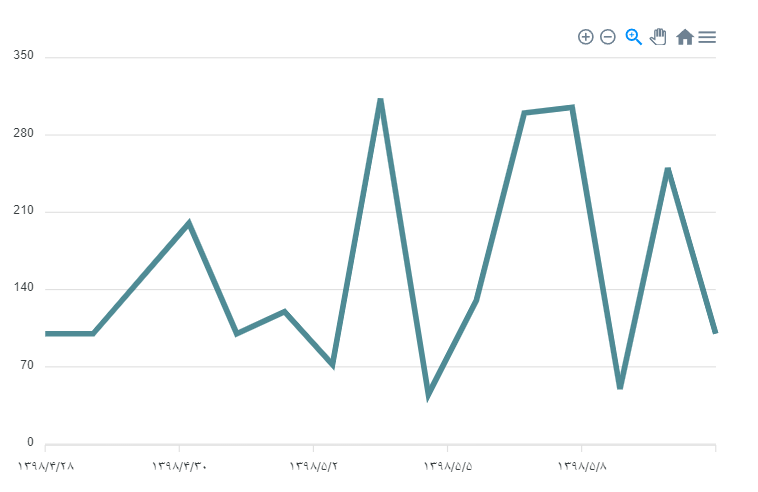
Actual Behavior
after using xaxis.labels.formatter, the position of each DateTime label and also the total number of labels is changed.
Screenshots
Reproduction Link
https://codepen.io/farshad-hasanpour/pen/MWENZVg
For what it's worth, this bug-- and I completely agree this is a bug, there's no reason whatsoever that the well-spaced timestamps that the chart uses without a formatter should shift when a formatter is added --appears to stem from this line. When the xaxis.labels.formatter configuration is not undefined, the context's TimeScale object is not initialized, the recalcDimensionsBasedOnFormat method is not called and the globals.timescaleLabels array is never properly constructed.
What is the point of the check on line 558 of Core.js? Why would we not bother setting up the proper timescale ticks whenever the x-axis is a datetime axis? Can that line just be removed?
Any update on this? Did anyone manage to solve it via a workarround ?
I disabled zooming and panning features then used the 'tickAmount' to create equal date points between min and max date.