Pivot table summary returning wrong results
I am using Preset Cloud, so not sure which version is used, as far as I can see Pivot table summary generate only 1 SQL Query, I would expect that it generate two.
- one for the rows
- another for the summary
see the results of the division which is wrong Actual/ Budget, I don't know how to tell superset to keep the same metric definition for the summary rows
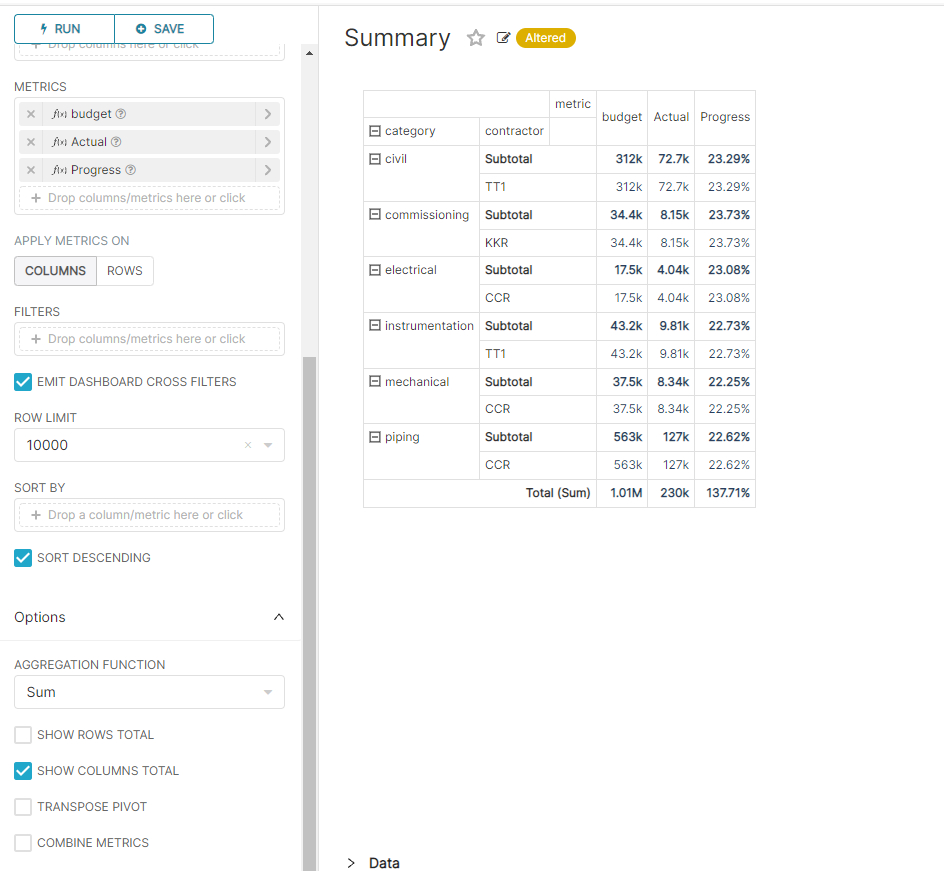
I'm not so sure this is a common use case. The Total (Sum) row is just that, a sum of the values in the column. By that definition, this chart is quite correct. If you want to use these totals formulaically against each other, that seems like it would be adding spreadsheet functionality that goes beyond the typical scope of a pivot table. @kgabryje @villebro curious your thoughts on this, if they differ.
yes, it is the default expectation how the measure works in any BI tools, I expect the summary row to respect the measure definition not doing a sum, if I want a sum, then I create a measure that explicitly say, for a summary row do a sum of a column
@djouallah Correct me if I'm wrong but the problem is the summing of the percentages in the Progress column in the Total (sum) row, right? This should be a weighted percentage. Summing percentages is useless.
@robjuffermans what I am saying having an option to do a sum in the first place is a wrong, I expect the summary row to respect the metric definition , that pretty much how any BI tools works (Tableau, PowerBI, Google Data Studio etc)
something like this see the percentage works at all level even in the summary rows

exactly, that's what I'm missing also. @rusackas this should be regarded normal functionality for a pivot table from my point of view.
This issue has been automatically marked as stale because it has not had recent activity. It will be closed if no further activity occurs. Thank you for your contributions. For admin, please label this issue .pinned to prevent stale bot from closing the issue.
CC @lauderbaugh and @yousoph in case you know how we can revisit this (and related issues) holistically. Adding @kgabryje since he's a SME on the implementation
@djouallah Did you find any workarounds already. I could imagine to build a chart per aggregation level but it feels far from perfect.
Ideally one can fold/unfold on all the dimension and (sub)totals should always respect the formula behind the metric instead of creating a sum of the metric results.
There are quite a few issues around this, which I'm trying to consolidate. I'll close this issue in favor of another that sums it up fairly concisely: https://github.com/apache/superset/issues/25747