partition chart shows wrong values when using 'group by'
Screenshot
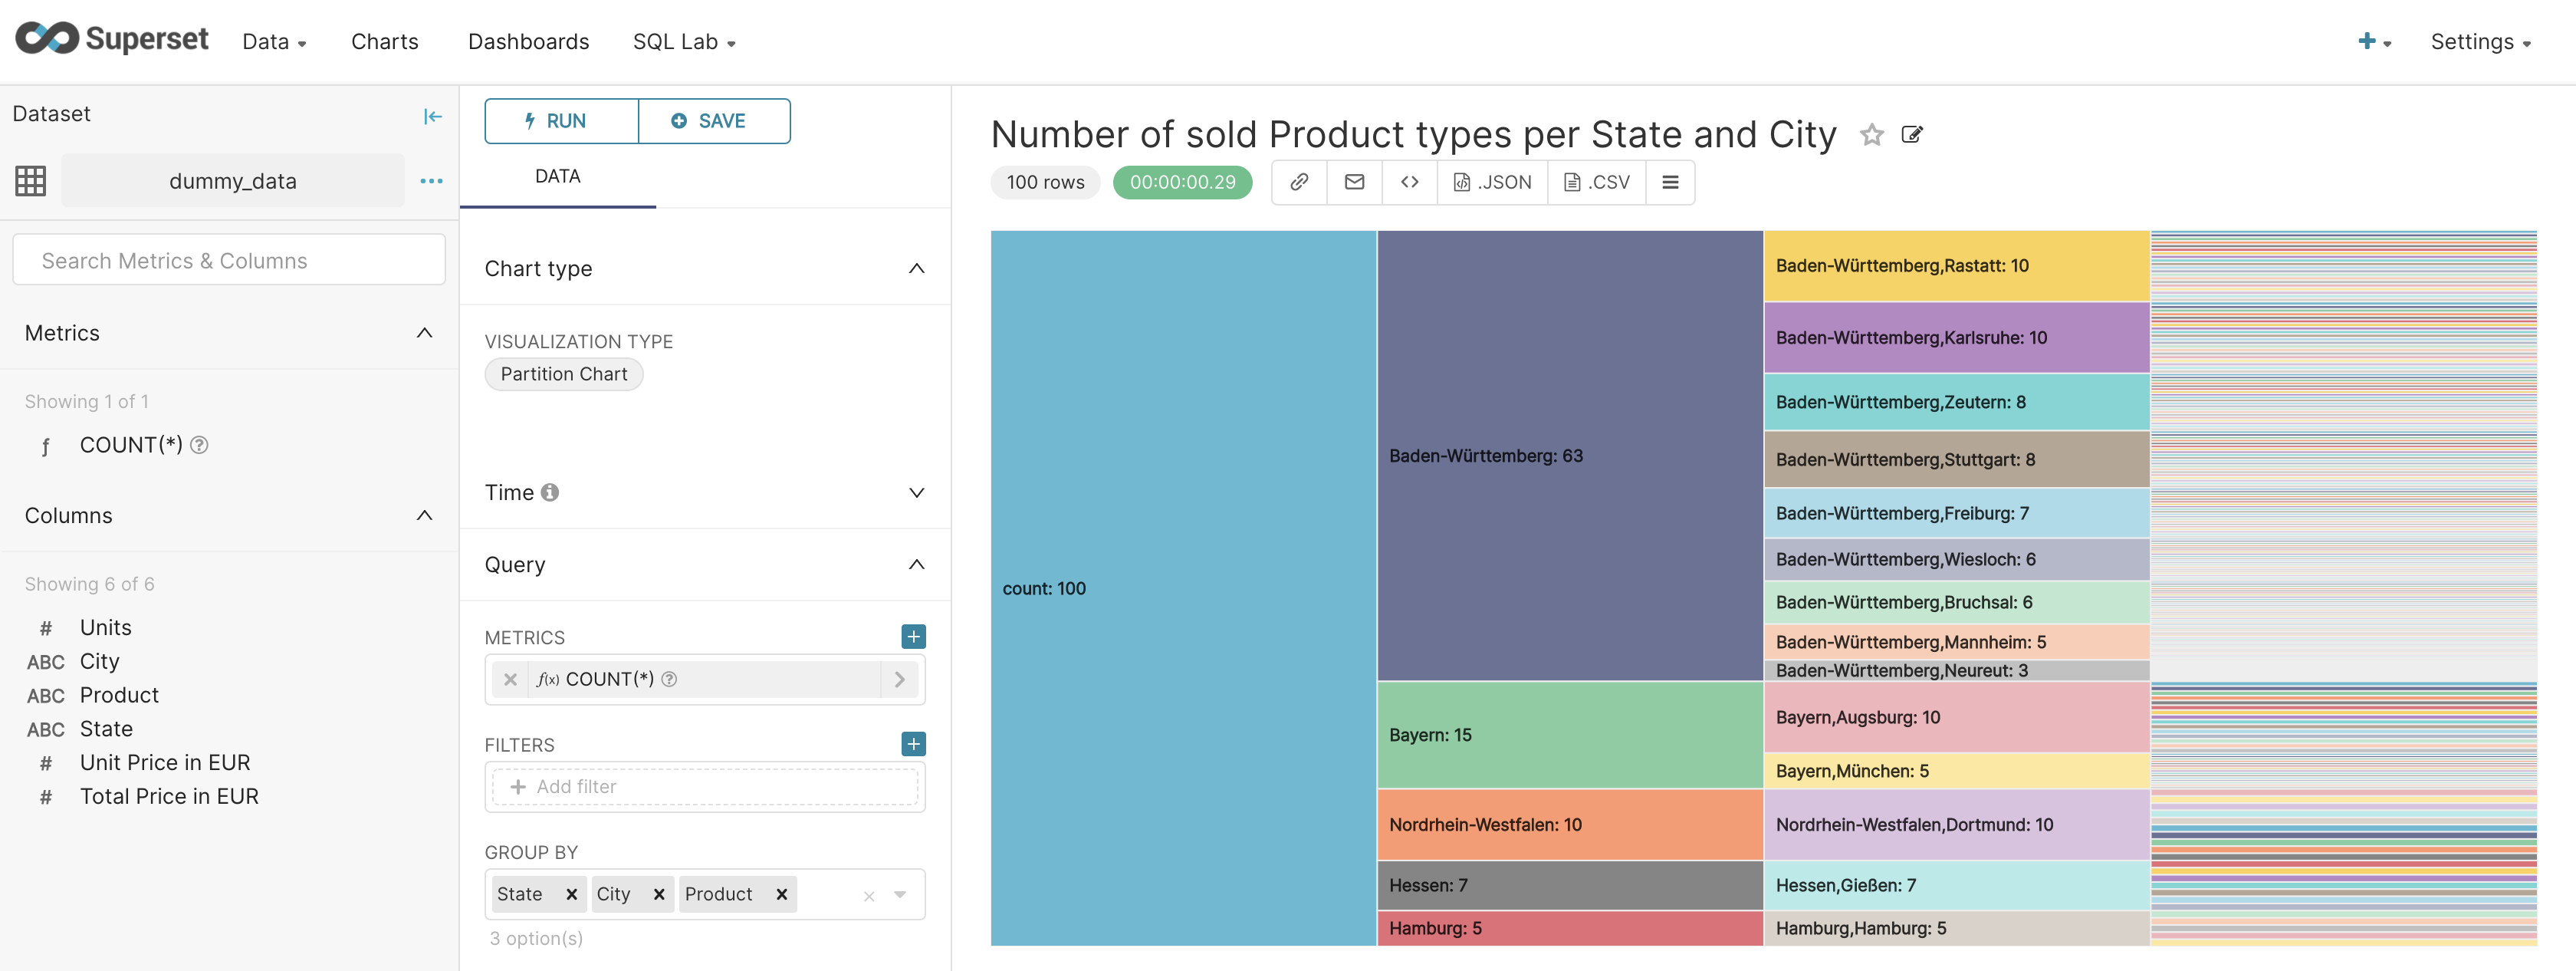

Description
Hello everyone!
I am trying to create a partition chart which shows the number of sold product types per city in german states. In the first screenshot you can see the cities in the correct states but if you click on a city (e.g. Karlsruhe in Baden-Württemberg) to view the product types the cities don't match the states anymore as in the second screenshot. Here's the link to my dataset. dataset_dummy.xlsx
I'm looking forward to your replies!
I see similar bug here, it seems partition chart only support up to 3 levels.
This issue has been automatically marked as stale because it has not had recent activity. It will be closed if no further activity occurs. Thank you for your contributions. For admin, please label this issue .pinned to prevent stale bot from closing the issue.
This issue is still occurring. Has there been any movement regarding a fix?
This is at risk of being closed as stale if we can't get any updates or reviews on the linked PR. Contributions/comments welcome!