[SOLR-16497] Allow finer grained locking in SolrCores
https://issues.apache.org/jira/browse/SOLR-16497
Access to loaded SolrCore instances is a synchronized read and write operation in SolrCores#getCoreFromAnyList. This method is touched by every request as every HTTP request is assigned the SolrCore it operates on.
Background
Under heavy load we discovered that application halts inside of Solr are becoming a serious problem in high traffic environments. Using Java Flight Recordings we discovered high accumulated applications halts on the modifyLock in SolrCores. In our case this means that we can only utilize our machines up to 25% cpu usage. With the fix applied, a utilization up to 80% is perfectly doable.
In our case this specific locking problem was masked by another locking problem in the
SlowCompositeReaderWrapper. > We'll submit our fix to the locking problem in theSlowCompositeReaderWrapperin a following issue.
Description
Our Solr instances utilizes the collapse component heavily. The instances run with 32 cores and 32gb Java heap on a rather small index (4gb). The instances scale out at 50% cpu load. We take Java Flight Recorder snapshots of 60 seconds
as soon the cpu usage exceeds 50%.
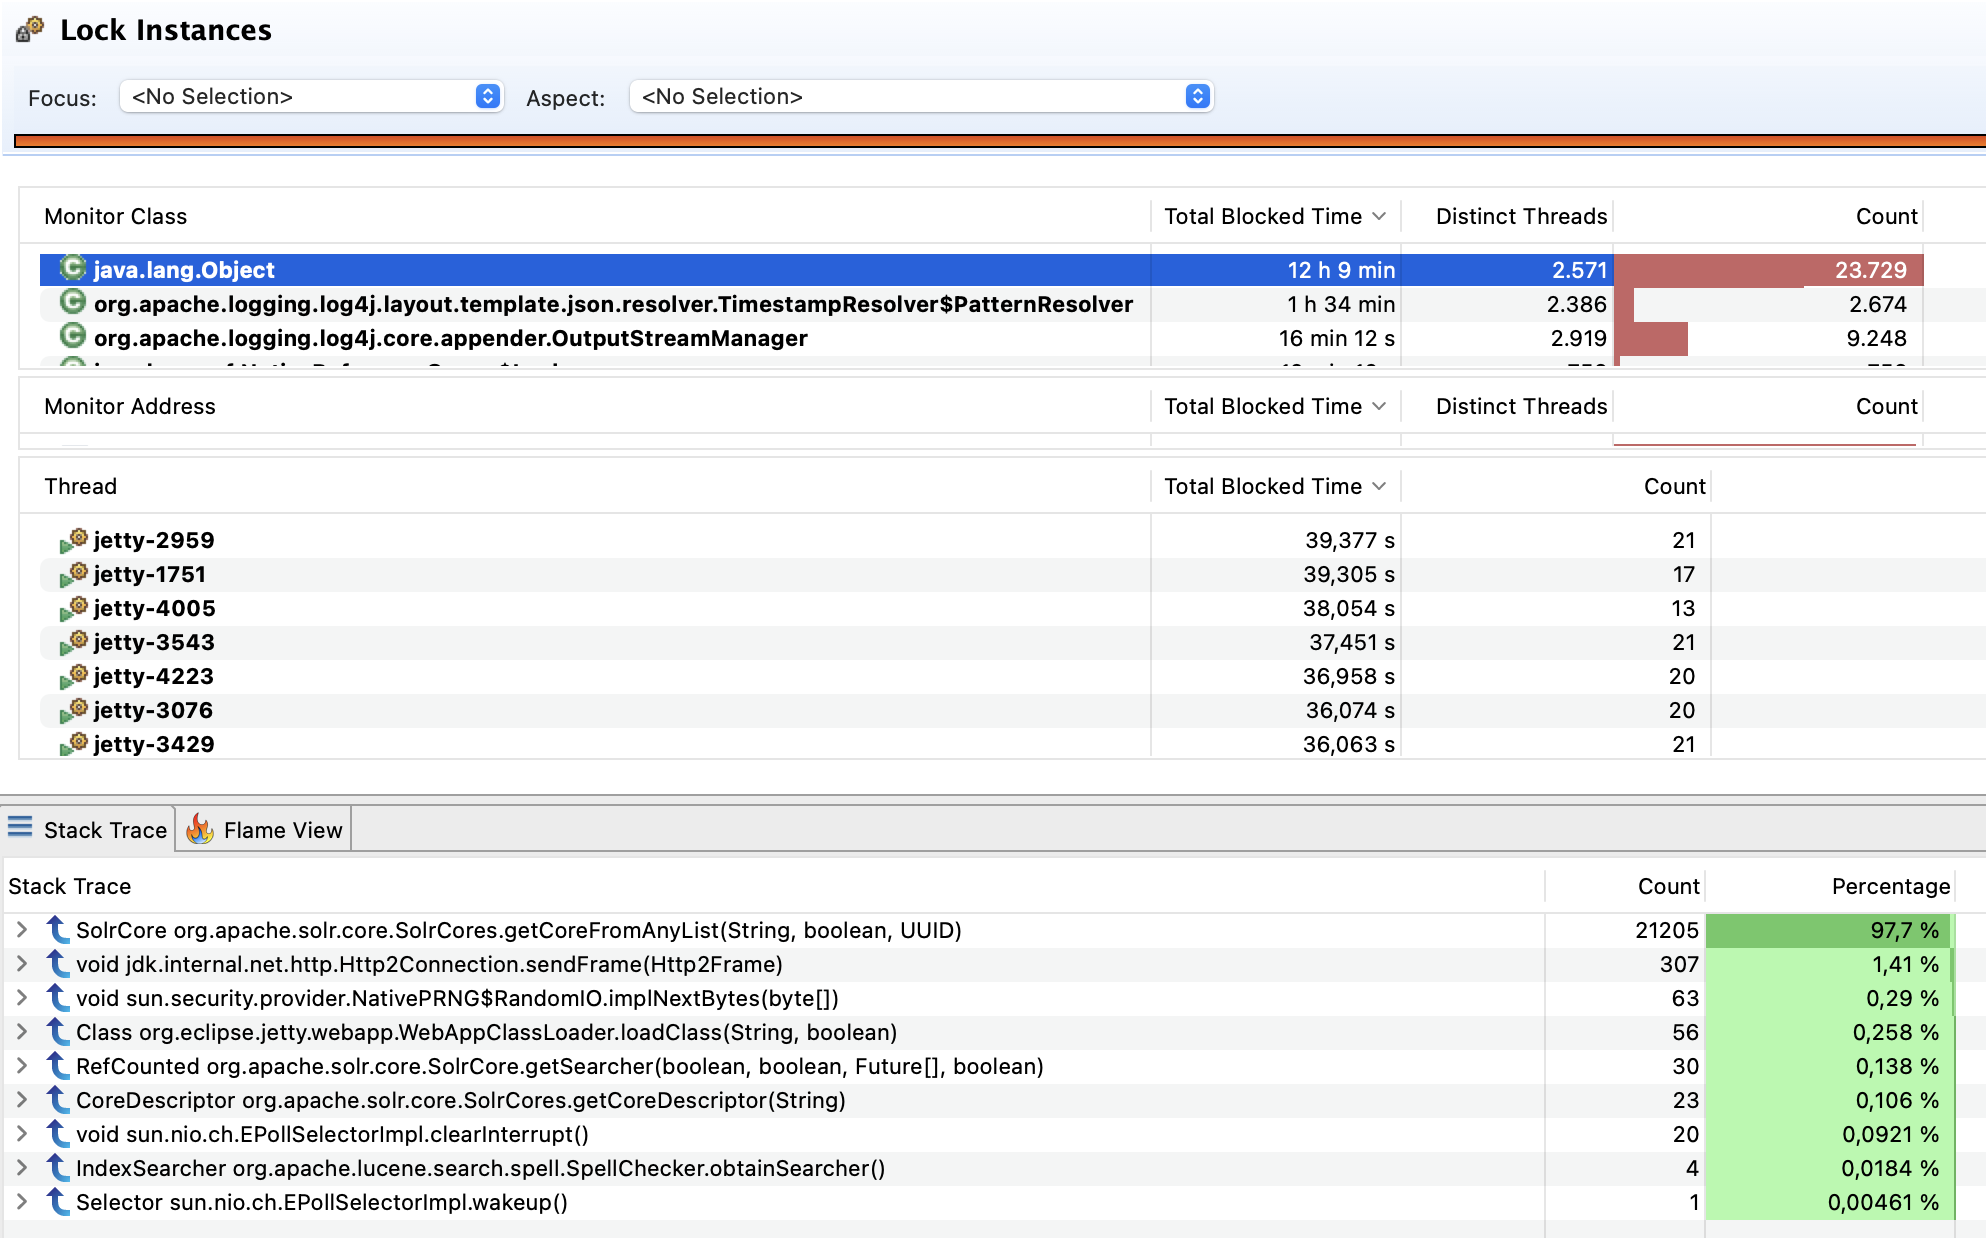
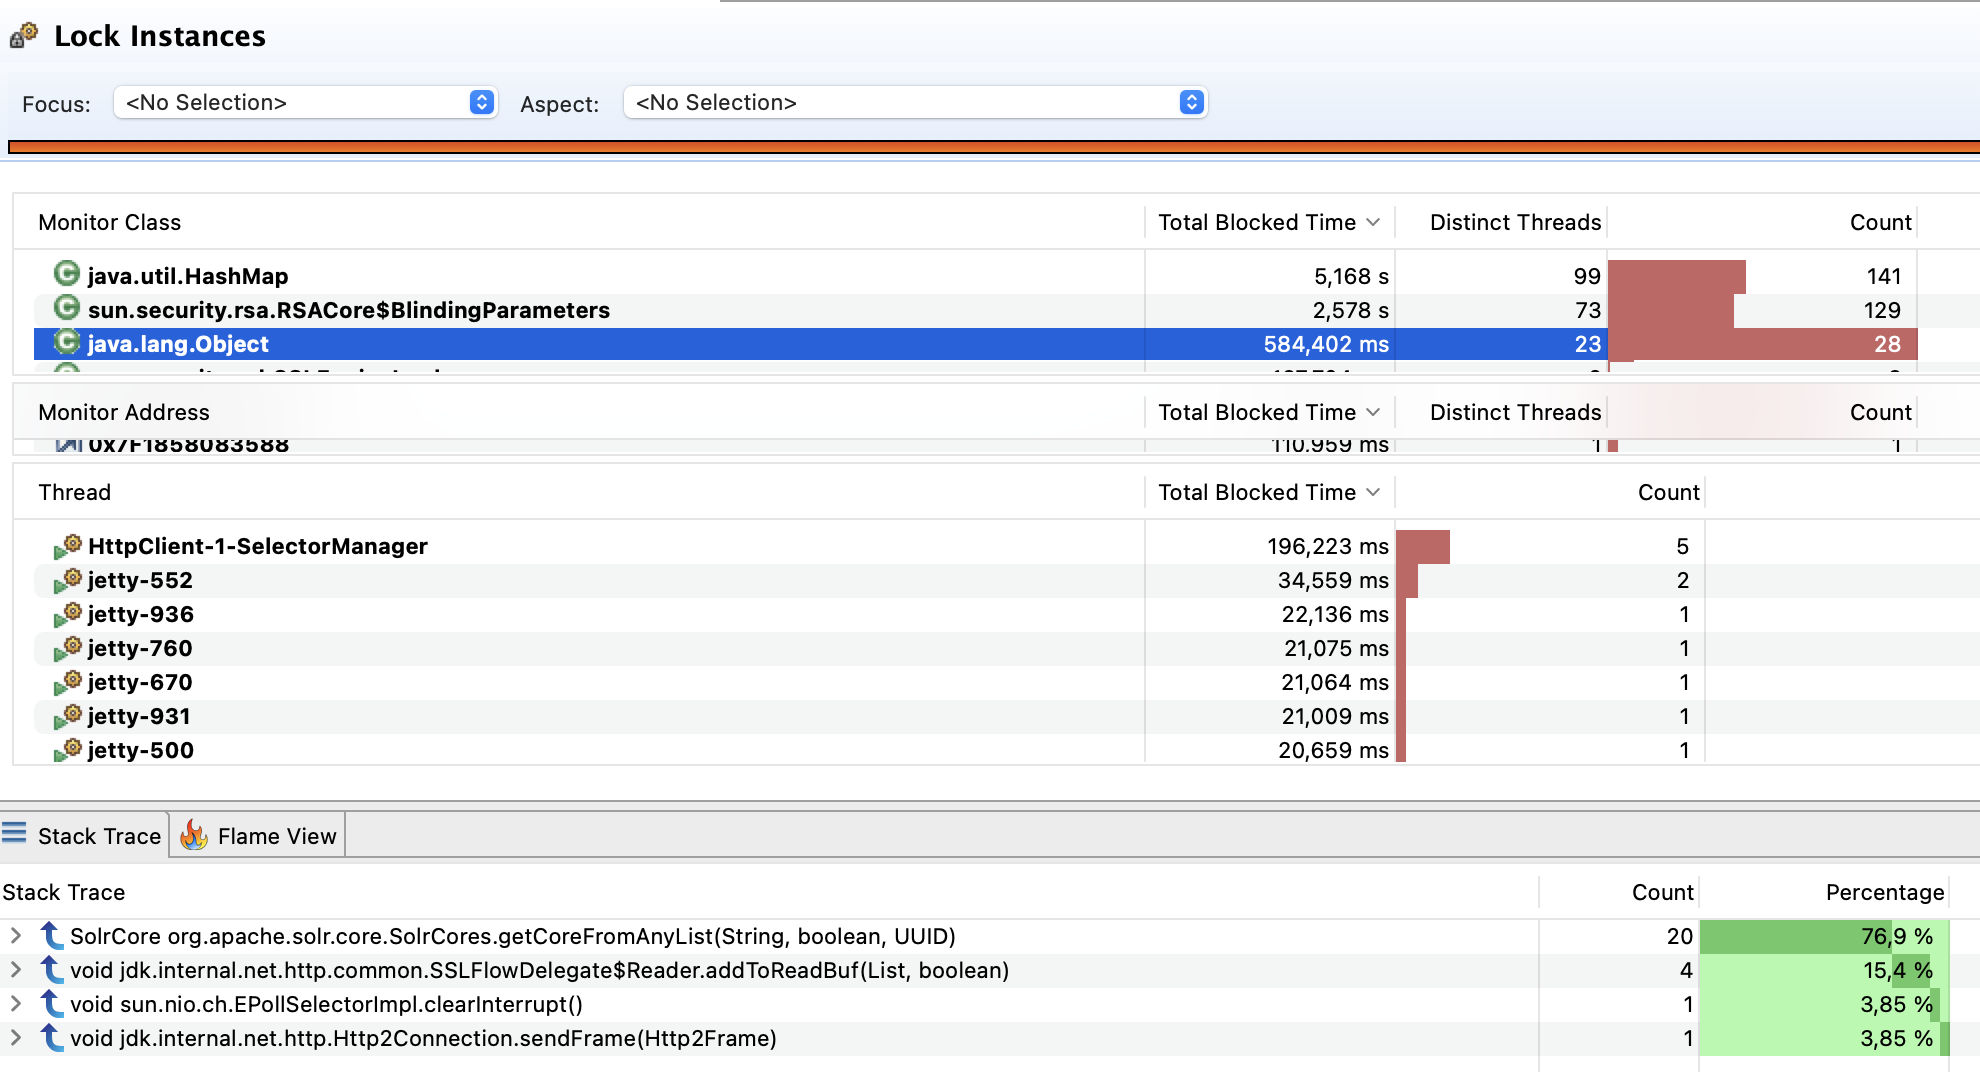
During our 60s Java Flight Recorder snapshot, the ~2k Jetty acceptor threads accumulated more than 12h locking time inside SolrCores on the modifyLock instance. The modifyLock instance is used as a synchronized lock (see screenshot). With this fix applied, the locking access is reduced to write accesses only. We validated this using another JFR snapshot:
We ran this code for a couple of weeks in our live environment in a backported version on a Solr version 8.11.2. This fix is built against the main branch.
Solution
The synchronized modifyLock is replaced by a ReentrantReadWriteLock. This allows concurrent reads from the internal SolrCore instance list (cores) but grants exclusive access to write operations on the instance list (cores).
In Solr 9.x the cache inside the TransientSolrCoreCacheFactoryDefault adds a cache overflow handling of the size based internal cache (SOLR-15964). As soon as SolrCores are evicted from the internal cache, the cache behaviour changes from a size based cache to a reference based cache via the cache's eviction handler. SolrCore instances that are still referenced are inserted back into the cache. This means that write operations to the cache (insert SolrCore) can be issued during read operations in SolrCores. Hence these operations have only a read lock which cannot be upgraded to a write lock (dead lock).
To overcome this, we moved the cache maintenance (including the eviction handler) in TransientSolrCoreCacheFactoryDefault to a separate thread. This thread can acquire a write lock but on the other hand a separate thread will schedule a ping-pong behaviour in the eviction handler on a full cache with SolrCores still referenced. To overcome this we made the overflow behaviour transparent by adding an additional overflowCores instance. Here we add evicted but still referenced cores from the transientCores cache.
Furthermore we need to ensure that only a single transientSolrCoreCache inside TransientSolrCoreCacheFactoryDefault is created. As we now allow multiple read threads, we call the the getTransientCacheHandler() method initially holding a write lock inside the load() method. Calling the method only needs a write lock initially (for cache creation). For all other calls, a read lock is sufficient. By default, the getTransientCacheHandler() acquires a read lock. If a write is needed (e.g. for core creation), the getTransientCacheHandlerInternal() is called. This method explicitly does not use a lock in order to provide the flexibility to choose between a read-lock and a write-lock. This ensures that a single instance of transientSolrCoreCache is created.
The lock signaling between SolrCore and CoreContainer gets replaced by a Condition that is tied to the write lock.
This change allows for a finer grained access to the list of open SolrCores. The decreased blocking read access is noticeable in decreased blocking times of the Solr application (see screenshot).
Checklist
Please review the following and check all that apply:
- [x] I have reviewed the guidelines for How to Contribute and my code conforms to the standards described there to the best of my ability.
- [x] I have created a Jira issue and added the issue ID to my pull request title.
- [x] I have given Solr maintainers access to contribute to my PR branch. (optional but recommended)
- [x] I have developed this patch against the
mainbranch. - [x] I have run
./gradlew check. - [x] I have added tests for my changes.
- [ ] I have added documentation for the Reference Guide
I have attempted to write a benchmark for this change to verify some of the perf gains. based on a limited understanding of the code, the PR looks reasonable to me, but the results I had are a bit different than expected. I am assuming the benchmark itself does not correctly mirror the setup used to perform this analysis.
I am maintaining 2 branches, one with only the benchmark and one with this PR + same benchmark. Running with openjdk: JDK 11.0.17, OpenJDK 64-Bit Server VM, 11.0.17+8
- Results on main branch with no changes
Iteration   1: 9129555.788 ops/s
Iteration   2: 9203237.026 ops/s
Iteration   3: 9232071.659 ops/s
Iteration   4: 9187238.556 ops/s

Result "org.apache.solr.core.SolrCoresBenchTest.getCoreFromAnyList":
  9188025.757 ±(99.9%) 278959.948 ops/s [Average]
  (min, avg, max) = (9129555.788, 9188025.757, 9232071.659), stdev = 43169.361
  CI (99.9%): [8909065.809, 9466985.706] (assumes normal distribution)

Benchmark                               Mode  Cnt        Score        Error  Units
SolrCoresBenchTest.getCoreFromAnyList  thrpt    4  9188025.757 ± 278959.948  ops/s
- Results on patch
Iteration   1: 1488901.065 ops/s
Iteration   2: 1503247.470 ops/s
Iteration   3: 1531084.510 ops/s
Iteration   4: 1464588.927 ops/s

Result "org.apache.solr.core.SolrCoresBenchTest.getCoreFromAnyList":
  1496955.493 ±(99.9%) 179578.485 ops/s [Average]
  (min, avg, max) = (1464588.927, 1496955.493, 1531084.510), stdev = 27789.969
  CI (99.9%): [1317377.008, 1676533.978] (assumes normal distribution)

Benchmark                               Mode  Cnt        Score        Error  Units
SolrCoresBenchTest.getCoreFromAnyList  thrpt    4  1496955.493 ± 179578.485  ops/s
We effectively drop from 9M ops/s to 1.5M ops/s. The main observation here is that the benchmark does not mirror the PR setup. this is obvious from the fact that there are no transient cores (as far as I understand loading and unloading cores will increase the locking time under heavy load).
I would like to understand how common is the setup that is using transient cores, the Solr Guide mentions that they are not recommended under SolrCloud: Core Discovery page under transient property. Also if there is interest I can spend more time tweaking this benchmark, I think having some way to verify/reproduce any perf change is very beneficial.
Transient cores is not supported in SolrCoud. I know this because I have a hack to make it sort-of work in SolrCloud at work. I've been meaning to review your PR finally; I keep telling myself that and hopefully it'll come true now-ish :-)
Just as a side note, we are not using transient cores at all. It's just about the lock contention when working with normal cores. Many thanks for providing the benchmark, I'll try to review, run and play with it this week. At first glance it doesn't make that much sense that it's 9 times slower, as the repeated function is more or less the same besides the lock. :-)
I was surprised at the results too, but I figured it's just my limited understanding of this code :) . I think the benchmark is too basic in its approach to cover the PR correctly, so please take a look and let me know what could be done to make it closer to real life operations.
Good to rule out the transient cores, but if this does not come into play, why all the changes around the getInternalTransientCacheHandler?
Basically the changes around the Handler are needed to get the read write locking correct. It's an all or nothing change. Even the smallest mistake could lead to a deadlock or missing cores. We were very careful in analyzing the relevant code paths, otherwise you risk deadlocks or undefined behaviour, e.g. thread switch while in critical block. Luckily the test suite is very good and revealed some problems.
Hi @stillalex, I've changed your proposed benchmark a little bit. See main and PR1155.
Main points are:
- I think you actually need to do something while holding the lock like it is in reality. So I've tried to mimic the behaviour of open() and close(). I set the parameter incRefCount to true in order to do something and I set doAnswer on SolrCore mock but it didn't work as expected. Basically you can't call a method intercepted by mockito inside your benchmarking function, because it will ruin it with lots of GC. The reason for this behaviour are those method interceptors and stacktrace objects, which all want to be GCed. I avoided that by introducing a consumer to do some work while the lock is being held:
SolrCore getCoreFromAnyList(String name, boolean incRefCount, UUID coreId, Consumer<SolrCore> callback) {
    READ_WRITE_LOCK.readLock().lock();
    try {
      SolrCore core = getCoreFromAnyList(name, incRefCount, coreId);
      callback.accept(core);
      return core;
    } finally {
      READ_WRITE_LOCK.readLock().unlock();
    }
  }
- I think one should limit the number of threads to the number of CPU cores, otherwise you're benchmarking context switching of OS threads.
To get an overview which public methods from SolrCores and CoreContainer are actually called and how frequent, I've checked a recent flight recorder image from one of our production machines. I was wondering if benchmarking getCoreFromAnyList() is sufficient to model the behaviour of our system. This is a 20 Minute frame without creation of a new Core. Here the distribution is in relation to the number of request calls.
- Requests 100%
- CoreContainer.getCore(String) 57% <--- this calls solrCores.getCoreFromAnyList
- CoreContainer.getRequestHandler(String) 36% <--- doesn't lock
- SolrCores.getCoreDescriptor(String) 12% <--- locks
- CoreContainer.getCore(String, UUID) 9% <--- this calls solrCores.getCoreFromAnyList
Here are my benchmark result runs:
The synchronized one:
$ cat results-synchronized.txt
running JMH with args: -prof jfr:dir=profile-results;configName=jfr-profile.jfc SolrCoresBenchTest
# Detecting actual CPU count: 12 detected
# JMH version: 1.32
# VM version: JDK 17.0.2, OpenJDK 64-Bit Server VM, 17.0.2+8-jvmci-22.0-b05
# VM invoker: /home/db/.sdkman/candidates/java/22.0.0.2.r17-grl/bin/java
# VM options: -Djmh.shutdownTimeout=5 -Djmh.shutdownTimeout.step=3 -Djava.security.egd=file:/dev/./urandom -XX:-UseBiasedLocking -XX:+UnlockDiagnosticVMOptions -XX:+DebugNonSafepoints --add-opens=java.base/java.lang.reflect=ALL-UNNAMED -Dlog4jConfigurationFile=./log4j2-bench.xml -Dlog4j2.is.webapp=false -Dlog4j2.garbagefreeThreadContextMap=true -Dlog4j2.enableDirectEncoders=true -Dlog4j2.enable.threadlocals=true -XX:+UseG1GC -XX:+ParallelRefProcEnabled
# Blackhole mode: full + dont-inline hint
# Warmup: 3 iterations, 10 s each
# Measurement: 4 iterations, 20 s each
# Timeout: 300 s per iteration
# Threads: 12 threads, will synchronize iterations
# Benchmark mode: Throughput, ops/time
# Benchmark: org.apache.solr.core.SolrCoresBenchTest.getCoreFromAnyList

# Run progress: 0,00% complete, ETA 00:01:50
# Fork: 1 of 1
# Preparing profilers: JavaFlightRecorderProfiler
OpenJDK 64-Bit Server VM warning: Option UseBiasedLocking was deprecated in version 15.0 and will likely be removed in a future release.
# Warmup Iteration   1: --> benchmark random seed: 6624420638116043983
1835172,373 ops/s
# Warmup Iteration   2: 1821486,883 ops/s
# Warmup Iteration   3: 1835960,182 ops/s
Iteration   1: 1650271,601 ops/s
Iteration   2: 1662880,927 ops/s
Iteration   3: 1661900,359 ops/s
Iteration   4: 1661879,729 ops/s
                 ·jfr: (text only)

# Processing profiler results: JavaFlightRecorderProfiler


Result "org.apache.solr.core.SolrCoresBenchTest.getCoreFromAnyList":
  1659233,154 ±(99.9%) 38724,163 ops/s [Average]
  (min, avg, max) = (1650271,601, 1659233,154, 1662880,927), stdev = 5992,607
  CI (99.9%): [1620508,991, 1697957,317] (assumes normal distribution)

Secondary result "org.apache.solr.core.SolrCoresBenchTest.getCoreFromAnyList:·jfr":
JFR profiler results:
  profile-results/org.apache.solr.core.SolrCoresBenchTest.getCoreFromAnyList-Throughput/profile.jfr
The rwlock one:
$ cat results-rwlock.txt
running JMH with args: -prof jfr:dir=profile-results;configName=jfr-profile.jfc SolrCoresBenchTest
# Detecting actual CPU count: 12 detected
# JMH version: 1.32
# VM version: JDK 17.0.2, OpenJDK 64-Bit Server VM, 17.0.2+8-jvmci-22.0-b05
# VM invoker: /home/db/.sdkman/candidates/java/22.0.0.2.r17-grl/bin/java
# VM options: -Djmh.shutdownTimeout=5 -Djmh.shutdownTimeout.step=3 -Djava.security.egd=file:/dev/./urandom -XX:-UseBiasedLocking -XX:+UnlockDiagnosticVMOptions -XX:+DebugNonSafepoints --add-opens=java.base/java.lang.reflect=ALL-UNNAMED -Dlog4jConfigurationFile=./log4j2-bench.xml -Dlog4j2.is.webapp=false -Dlog4j2.garbagefreeThreadContextMap=true -Dlog4j2.enableDirectEncoders=true -Dlog4j2.enable.threadlocals=true -XX:+UseG1GC -XX:+ParallelRefProcEnabled
# Blackhole mode: full + dont-inline hint
# Warmup: 3 iterations, 10 s each
# Measurement: 4 iterations, 20 s each
# Timeout: 300 s per iteration
# Threads: 12 threads, will synchronize iterations
# Benchmark mode: Throughput, ops/time
# Benchmark: org.apache.solr.core.SolrCoresBenchTest.getCoreFromAnyList

# Run progress: 0,00% complete, ETA 00:01:50
# Fork: 1 of 1
# Preparing profilers: JavaFlightRecorderProfiler
OpenJDK 64-Bit Server VM warning: Option UseBiasedLocking was deprecated in version 15.0 and will likely be removed in a future release.
# Warmup Iteration   1: --> benchmark random seed: 6624420638116043983
2415802,757 ops/s
# Warmup Iteration   2: 2426055,238 ops/s
# Warmup Iteration   3: 2417938,908 ops/s
Iteration   1: 2342669,342 ops/s
Iteration   2: 2360751,931 ops/s
Iteration   3: 2343344,162 ops/s
Iteration   4: 2363582,478 ops/s
                 ·jfr: (text only)

# Processing profiler results: JavaFlightRecorderProfiler


Result "org.apache.solr.core.SolrCoresBenchTest.getCoreFromAnyList":
  2352586,978 ±(99.9%) 71895,415 ops/s [Average]
  (min, avg, max) = (2342669,342, 2352586,978, 2363582,478), stdev = 11125,895
  CI (99.9%): [2280691,563, 2424482,393] (assumes normal distribution)

Secondary result "org.apache.solr.core.SolrCoresBenchTest.getCoreFromAnyList:·jfr":
JFR profiler results:
  profile-results/org.apache.solr.core.SolrCoresBenchTest.getCoreFromAnyList-Throughput/profile.jfr
@debe thank you for taking a look!
First off, mockito is troublesome. we can take it out completely if there is a way to setup solr without it. I added it only for the transient cores part. same for the lookup misses, it was just an attempt to reproduce the results.
I think you actually need to do something while holding the lock like it is in reality.
I don't completely follow there. what else happens inside the lock block from getCoreFromAnyList? ideally we would test the code as is, I don't see anything else inside that method. by introducing the consumer you are artificially increasing the time spent inside the lock, is this a better mirror of a running system?
I think one should limit the number of threads to the number of CPU cores, otherwise you're benchmarking context switching of OS threads.
I agree with this point, anything we can tweak on the benchmark settings to get it closer to real life is good for me.
To get an overview which public methods from SolrCores and CoreContainer are actually called and how frequent, I've checked a recent flight recorder image from one of our production machines.
thank you for this data. I would like to use it as a reference for the benchmark, but ideally we would setup the core without any interventions (still not 100% sold on the extra consumer you added).
@debe thank you for taking a look!
First off, mockito is troublesome. we can take it out completely if there is a way to setup solr without it. I added it only for the transient cores part. same for the lookup misses, it was just an attempt to reproduce the results.
I think you actually need to do something while holding the lock like it is in reality.
I don't completely follow there. what else happens inside the lock block from getCoreFromAnyList? ideally we would test the code as is, I don't see anything else inside that method. by introducing the consumer you are artificially increasing the time spent inside the lock, is this a better mirror of a running system?
Ahhh, no I think this is a misunderstanding. I exactly copied the work that is actually done. CoreContainer.getCore() set's incRefCount to true and triggers SolrCore.open(). If you set IncRefCount to false the call to core.open() never happens and therefore everything inside open() which are MDC.put calls (I've counted them) and atomicInt incrementation.
I think one should limit the number of threads to the number of CPU cores, otherwise you're benchmarking context switching of OS threads.
I agree with this point, anything we can tweak on the benchmark settings to get it closer to real life is good for me.
To get an overview which public methods from SolrCores and CoreContainer are actually called and how frequent, I've checked a recent flight recorder image from one of our production machines.
thank you for this data. I would like to use it as a reference for the benchmark, but ideally we would setup the core without any interventions (still not 100% sold on the extra consumer you added).
Ahhh, no I think this is a misunderstanding. I exactly copied the work that is actually done. CoreContainer.getCore() set's incRefCount to true and triggers SolrCore.open(). If you set IncRefCount to false the call to core.open() never happens and therefore everything inside open() which are MDC.put calls (I've counted them) and atomicInt incrementation.
@debe I see what you mean now. I think you are right, the things you added are equivalent to what is happening inside the lock. one would have to wonder why they are inside the lock in the first place (refCount.incrementAndGet(); does not strike me as needing synchronization).
I wish transient cores was better isolated to users that opt-in to use it. I'm thinking, "SolrCores" could be pluggable with a subclass that supports TransientCores; the default (SolrCores itself) would not. Then we could do something simple for the default implementation and delay how to handle transient cores. For example this read/write lock stuff could be in the default/base impl but we leave the transient cache implementing one alone (wouldn't have this optimization, at least for now). This doesn't seem hard and lets us punt on transient core complexity ramifications. It makes the default case easier to understand (no transient core code interaction) and with the PR here, removes a bottleneck you saw.
If this sounds good, I volunteer to do the refactoring and then you could re-do your PR on the result of that. The impact of the refactoring on transient cores might be back-compat as well, but I think it's too little used to worry much.
+1 to extract the support of transient cores as a subclass of SolrCores.
Refactoring SolrCores with TransientCores support and SolrCores without TransientCores support into separate implementations is really a good idea. +1 We would re-do our PR on the result of that. Would be great if we could still make it in time for 9.2
Should we change the overflow cache to a Map in the mean time, to get this PR going? what do you think?
chers, -dennis
@debe I have finally had some time to update the benchmark to remove mockito and only use pure SolrCore code for verification. I think I have taken all the noise out of it, but unfortunately this is back to my initial results, showing a slowdown in the PR, could you take another look?
  7013249.176 ±(99.9%) 420959.068 ops/s [Average]
  (min, avg, max) = (6986952.973, 7013249.176, 7030112.165), stdev = 23074.187
  CI (99.9%): [6592290.109, 7434208.244] (assumes normal distribution)
PR (main branch + pr patch):
  1492787.497 ±(99.9%) 567915.344 ops/s [Average]
  (min, avg, max) = (1468715.133, 1492787.497, 1527941.373), stdev = 31129.356
  CI (99.9%): [924872.153, 2060702.841] (assumes normal distribution)
@dsmiley is the benchmark useful in its current form? I would like to contribute it along with the PR (seeing the results it probably still needs a few tweaks). let me know if this is something you are interested in, otherwise I can leave it out this conversation.
@stillalex Hi Alex, before I'll go into christmas holidays, we're back in january, we'd like to comment on your recent results.
We think synchronized is currently faster because there is some substantial work inside the synchronized block missing, compared to a real world scenario. The reason for this is that the cloudDescriptor is null and therefore 3 MDC.put() calls in MDCLoggingContext.setCoreDescriptor() are not getting executed and we've noticed that the core doesn't get closed anymore, but it should probably be closed inside the benchmark.
First we'd like to thank you again for bringing up the discussion about how to prove that certain code paths are perfoming better or worse and to increase the understanding about locking in the solr community. We think this was a great idea and basically the question behind it is "does this PR help at all to make things better". Nevertheless we've difficulties to take conclusions from the outcome of this benchmark. What it basically does is it answers the question whether a function call to getCoreFromAnyList() without thread congestion and side effects performs better or worse when using sychronized vs. ReentrantReadWriteLock. The answer is that synchronized will perform similar or better depending on the number of CPU cores and that it uses far less resources. We suspect that the adaptive spinning of the lightweight locks used in synchronized in the JVM learns pretty quickly, that the benchmark consists mostly of a synchronized block and that there is not much that can run in parallel anyway and how to align the calls to getCoreFromAnyList() to get away with no heavy weight locking at all.
So the problem is the synchronized behaviour of an entire solr when thread congestion, sideeffects like a big ThreadContext, other method calls grabbing the lock and possibly IO are happening. Then you can't guarantee that fast behaviour any more and it is very difficult to construct a micro benchmark that covers such cases. What ReentrantReadWriteLock can guarantee you is that it will never block read access even when you have congestion and lots of side effects, like slow MDC.put() calls, a big ThreadContext and so on. That's the most valuable advantage. In the new year we can do a macro (e.g. http) benchmark on our side again to verify a benefit and extract flight recorder dumps plus we plan to measure timings in each synchronized entrance and exit. Maybe we can find the root cause of long waits for the lock. But then again it's not about that our use case will be much faster then, it's about that you can construct a solr usage pattern which will severely suffer from synchronized blocks but which will never suffer using a ReentrantReadWriteLock.
Sincerely, @mpetris(Marco) and @debe (Dennis)
This PR had no visible activity in the past 60 days, labeling it as stale. Any new activity will remove the stale label. To attract more reviewers, please tag someone or notify the [email protected] mailing list. Thank you for your contribution!
We are actively rewriting this fix to bring it to 9.X, 9.5.0 and main. I'd keep this open for now. Our progress is visible here https://github.com/otto-de/solr and we'll contribute it back from that repo. Chers, -dennis
This PR had no visible activity in the past 60 days, labeling it as stale. Any new activity will remove the stale label. To attract more reviewers, please tag someone or notify the [email protected] mailing list. Thank you for your contribution!