ozone
 ozone copied to clipboard
HDDS-2642. Expose decommission / maintenance metrics via JMX
What changes were proposed in this pull request?
To expose metrics from nodes entering the decommissioning and maintenance workflow to JMX and prom endpoint. These metrics expose the number of datanodes in the workflow, the container replication state of tracked nodes and the number of pipelines waiting to close of tracked nodes. With the following exposed metrics from the NodeDecommissionManager through the DataAdminMonitorImpl the progress of the decommission and maintenance workflow can be monitored.
The progress of datanodes going though the workflow are monitored through aggregated counts of the number of tracked nodes, their number of pipelines waiting to close and the number of containers in each of sufficiently, under-replicated and unhealthy state. The metrics collected are as discussed in the associated Jira comments,
As exposed to prom endpoint:
aggregated total number of datanodes in workflow:
node_decommission_metrics_total_tracked_decommissioning_maintenance_nodes
Of tracked datanodes in workflow, the container replication state; total number of containers in each of sufficiently replicated, under-replicated and unhealthy state
node_decommission_metrics_total_tracked_containers_sufficiently_replicated
node_decommission_metrics_total_tracked_containers_under_replicated
node_decommission_metrics_total_tracked_containers_unhealthy
Of tracked datanodes in workflow, the aggregated number of pipelines waiting to close
node_decommission_metrics_total_tracked_pipelines_waiting_to_close
And, the number of datanodes in the workflow that are taken out and recommissioned.
node_decommission_metrics_total_tracked_recommission_nodes
Similarly exposed via JMX:
 {
    "name" : "Hadoop:service=StorageContainerManager,name=NodeDecommissionMetrics",
    "modelerType" : "NodeDecommissionMetrics",
    "tag.Hostname" : "e68cfe1f098e",
    "TotalTrackedDecommissioningMaintenanceNodes" : 0,
    "TotalTrackedRecommissionNodes" : 0,
    "TotalTrackedPipelinesWaitingToClose" : 0,
    "TotalTrackedContainersUnderReplicated" : 0,
    "TotalTrackedContainersUnhealthy" : 0,
    "TotalTrackedContainersSufficientlyReplicated" : 0
  }
What is the link to the Apache JIRA
https://issues.apache.org/jira/browse/HDDS-2642
How was this tested?
Unit tests, CI workflow and manually tested with dev docker-cluster entering nodes in decommissioning workflow monitoring metrics collected in prom endpoint.
Unit tests:
hadoop-hdds/server-scm$ mvn -Dtest=TestNodeDecommissionMetrics test
INFO] ------------------------------------------------------- [INFO] T E S T S [INFO] ------------------------------------------------------- [INFO] Running org.apache.hadoop.hdds.scm.node.TestNodeDecommissionMetrics [INFO] Tests run: 8, Failures: 0, Errors: 0, Skipped: 0, Time elapsed: 1.072 s - in org.apache.hadoop.hdds.scm.node.TestNodeDecommissionMetrics [INFO] [INFO] Results: [INFO] [INFO] Tests run: 8, Failures: 0, Errors: 0, Skipped: 0 [INFO]
Manual testing via dev docker-cluster:
modify the docker-config for scm serviceid and serviceid-address:
hadoop-ozone/dist/target/ozone-1.3.0-SNAPSHOT/compose/ozone$
OZONE-SITE.XML_ozone.scm.nodes.scmservice=scm
OZONE-SITE.XML_ozone.scm.address.scmservice.scm=scm
set docker-compose for monitoring with prometheus:
export COMPOSE_FILE=docker-compose.yaml:monitoring.yaml
hadoop-ozone/dist/target/ozone-1.3.0-SNAPSHOT/compose/ozone$ docker-compose up -d --scale datanode=3
view metrics through prom endpoint : http://localhost:9090
Decomission datanode from scm bash prompt:
$ ozone admin datanode decommission -id=scmservice --scm=172.26.0.3:9894 3224625960ec
The changes look good, but I think it would be much more useful if we could track metric at the decommissioning node level too. Ie:
TotalTrackedContainersUnderReplicatedForHostname = xyz
I had a look at the ReplicationManagerMetric class, and in there, is an example of how to form a metric "on the fly" using:
private static final MetricsInfo INFLIGHT_REPLICATION = Interns.info(
      "InflightReplication",
      "Tracked inflight container replication requests.");
I think it should be possible store the counts per hostname in a map or list, and then when the metrics are snapshot, form dynamic metric names for the host level under / over / unhealthy container counts.
Also keep the aggregate metrics. These host level metrics would let people see if one host is stuck or if all are making progress etc.
HDFS has a metric like this:
"DecomNodes" : "{\"cdh-6x-of-1.cdh-6x-of.root.hwx.site:20002\":{\"xferaddr\":\"172.27.52.133:20002\",\"underReplicatedBlocks\":0,\"decommissionOnlyReplicas\":0,\"underReplicateInOpenFiles\":0}}",
It seems to register a MBean instance in the FSNameSystem class. Then it has a few places it provides these JSON key values in the metrics.
Thanks @sodonnel for your help to expose the decommission / maintenance metrics for monitoring the workflow. As you suggested, I've added metrics to monitor the workflow progress by host. These host based metrics are created dynamically and track the pipeline and container state for datanodes going through the decommissioning and maintenance workflow.
The metrics include, node_decommission_metrics_tracked_pipelines_waiting_to_close_ozone_datanode_3_ozone_default node_decommission_metrics_tracked_sufficiently_replicated_ozone_datanode_3_ozone_default node_decommission_metrics_tracked_unhealthy_containers_localhost node_decommission_metrics_tracked_under_replicated_containers_localhost (hostname marked in bold)
JMX and prom metrics collected for monitoring decommissioning and maintenance mode workflow updated to included collecting metrics by host. Examples of metrics captured follow.
JMX sample with hosts ozone-datanode-3.ozone_default and ozone-datanode-1.ozone_default :
    "modelerType" : "NodeDecommissionMetrics",
    "tag.Context" : "ozone",
    "tag.Hostname" : "e8772c7d7c4c",
    "TrackedDecommissioningMaintenanceNodesTotal" : 1,
    "TrackedRecommissionNodesTotal" : 0,
    "TrackedPipelinesWaitingToCloseTotal" : 2,
    "TrackedContainersUnderReplicatedTotal" : 0,
    "TrackedContainersUnhealthyTotal" : 0,
    "TrackedContainersSufficientlyReplicatedTotal" : 0,
    "TrackedContainersSufficientlyReplicatedTotal" : 0,
    "TrackedContainersUnderReplicatedTotal" : 0,
    "TrackedContainersUnhealthyTotal" : 0,
    "TrackedDecommissioningMaintenanceNodesTotal" : 1,
    "TrackedPipelinesWaitingToCloseTotal" : 2,
    "TrackedRecommissionNodesTotal" : 0,
    "trackedPipelinesWaitingToClose-ozone-datanode-3.ozone_default" : 0,
    "trackedSufficientlyReplicated-ozone-datanode-3.ozone_default" : 0,
    "trackedUnderReplicated-ozone-datanode-3.ozone_default" : 0,
    "trackedUnhealthyContainers-ozone-datanode-3.ozone_default" : 0,
    "trackedPipelinesWaitingToClose-ozone-datanode-1.ozone_default" : 2
  }, {
And, prom endpoint capturing decommissioning datanodes 3 and 1 in captured image:
Thanks for updating the formatting. I have a few more comments around code reuse and also a possible bug to check on. Also a conflict has appeared against one class which needs resolved.
One other thing I spotted:
    "TrackedPipelinesWaitingToCloseTotal" : 2,
    "TrackedRecommissionNodesTotal" : 0,
    "trackedPipelinesWaitingToClose-ozone-datanode-3.ozone_default" : 0,
    "trackedSufficientlyReplicated-ozone-datanode-3.ozone_default" : 0,
    "trackedUnderReplicated-ozone-datanode-3.ozone_default" : 0,
    "trackedUnhealthyContainers-ozone-datanode-3.ozone_default" : 0,
The host level metrics start with a lower case letter, but the others start with upper case. We should be consistent here inline with what other metrics do.
Why use threadLocal variables in the latest patch? Does this even work? If another thread reads the values set by the monitor thread, does it even get the values, as they should be local to the thread who set them?
Lets take a step back. The Decommission Monitor thread is synchronised already, and at the end of a run, the accumulated values for the metrics can be sent to the gauge, while still under the lock.
In that way, a consistent set of metrics can be sent to the gauge. However they are being sent to the gauge over a number of calls, so the gauge could be snapshot halfway through, giving inconsistent results.
Instead, you can make the snapshot method in the metrics class synchronized. Then in the sendMetricsToGauge method, you can wrap all the calls to the metrics class in a synchronized block too:
  private synchronized void setMetricsToGauge() {
    synchronized(metrics) {
      metrics.setTrackedContainersUnhealthyTotal(unhealthyContainers.get());
      metrics.setTrackedRecommissionNodesTotal(trackedRecommission.get());
      metrics.setTrackedDecommissioningMaintenanceNodesTotal(
              trackedDecomMaintenance.get());
      metrics.setTrackedContainersUnderReplicatedTotal(
              underReplicatedContainers.get());
      metrics.setTrackedContainersSufficientlyReplicatedTotal(
              sufficientlyReplicatedContainers.get());
      metrics.setTrackedPipelinesWaitingToCloseTotal(pipelinesWaitingToClose
          .get());
      metrics.metricRecordOfContainerStateByHost(containerStateByHost.get());
    }
  }
That way, we get a consistent set of metrics into the metric class, and block the getMetrics(...) method from executing when the metrics are in the process of being updated, preventing any race conditions.
I think you should revert that latest commit, and the synchronised part as I suggested here, and then we can see if we can clean up the reset side of things (which I think you already did here).
Why use
threadLocalvariables in the latest patch? Does this even work?
With the changes to the collecting the metrics in the DatanodeAdminMonitorImpl with on each iteration clearing the Map and then updating the container state for each active node in the workflow, it triggered synchronization (blocked) warnings (findbugs) due to setting the global Maps and counters in the scheduled monitor threads. To resolve this, with the thread having its own thread context there is no conflict. Maybe I've misunderstood its behavior here,
If another thread reads the values set by the monitor thread, does it even get the values, as they should be local to the thread who set them?
The monitor is the only thread setting the values and writing to the metrics. Each run of the monitor thread has its own context through threadlocal variables. Is this a problem? Will there, is it possible to have another thread try to access content belonging to another thread? I can revert the threadlocal changes easily, however we will be seeing the synchronized block problems when setting the individual counters in the DatanodeAdminMonitorImpl such as for the pipelinesWaitingToClose .
ThreadLocal should not be needed for this. I feel there is probably a simpler solution we can use, but I would need to see the original error first.
I took the code you have pushed here, reverted the last commit and implemented some changes to make it simpler and fix the synchronization issue. Please have a look here:
https://github.com/sodonnel/hadoop-ozone/tree/neil-metrics
some changes to make it simpler and fix the synchronization issue
Thanks. Pushed similar changes for simplification and fix for synchronization issue in latest commit after revert. Some minor cleanup and changes to follow.
Pushed new changes that finish the clean up for the metrics reset and collection in the monitor. In addition the metric in the NodeDecommisionMetrics changed for container state metrics per node in the workflow.
Now, a single metric name is used for the same metric collected for each datanode, within the metric is an associated tag that identifies the node for the metric reading, ie. `node_decommission_metrics_tracked_sufficiently_replicated_dn{datanode="ozone-datanode-2.ozone_default",hostname="39160451dea0"}.
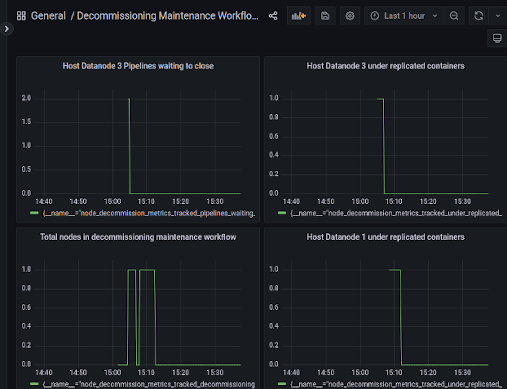
The decommissioning / maintenance workflow is tracked by JMX displaying each aggregated metric and displaying the node container state metrics only when the node is in the workflow. Prometheus now also displays each aggregated metric but now under a unique metric name for each container state metric, displays each host associated with the reading as a tag. This can be seen below in a workflow decommissioning datanode-3:
during:
    "name" : "Hadoop:service=StorageContainerManager,name=NodeDecommissionMetric
s",
    "modelerType" : "NodeDecommissionMetrics",
    "tag.Hostname" : "39160451dea0",
    "TrackedDecommissioningMaintenanceNodesTotal" : 1,
    "TrackedRecommissionNodesTotal" : 0,
    "TrackedPipelinesWaitingToCloseTotal" : 0,
    "TrackedContainersUnderReplicatedTotal" : 1,
    "TrackedContainersUnhealthyTotal" : 0,
    "TrackedContainersSufficientlyReplicatedTotal" : 0,
    "tag.datanode.1" : "ozone-datanode-3.ozone_default",
    "tag.Hostname.1" : "39160451dea0",
    "TrackedUnderReplicatedDN.1" : 1,
    "tag.datanode.2" : "ozone-datanode-3.ozone_default",
    "tag.Hostname.2" : "39160451dea0",
    "TrackedSufficientlyReplicatedDN.2" : 0,
    "tag.datanode.3" : "ozone-datanode-3.ozone_default",
    "tag.Hostname.3" : "39160451dea0",
    "TrackedPipelinesWaitingToCloseDN.3" : 0,
    "tag.datanode.4" : "ozone-datanode-3.ozone_default",
    "tag.Hostname.4" : "39160451dea0",
    "TrackedUnhealthyContainersDN.4" : 0
  }, {
after,
 }, {
    "name" : "Hadoop:service=StorageContainerManager,name=NodeDecommissionMetrics",
    "modelerType" : "NodeDecommissionMetrics",
    "tag.Hostname" : "39160451dea0",
    "TrackedDecommissioningMaintenanceNodesTotal" : 0,
    "TrackedRecommissionNodesTotal" : 0,
    "TrackedPipelinesWaitingToCloseTotal" : 0,
    "TrackedContainersUnderReplicatedTotal" : 0,
    "TrackedContainersUnhealthyTotal" : 0,
    "TrackedContainersSufficientlyReplicatedTotal" : 0
  }, {
and Prometheus, decommission datanode-2 (green) and datanode-3 (yellow):
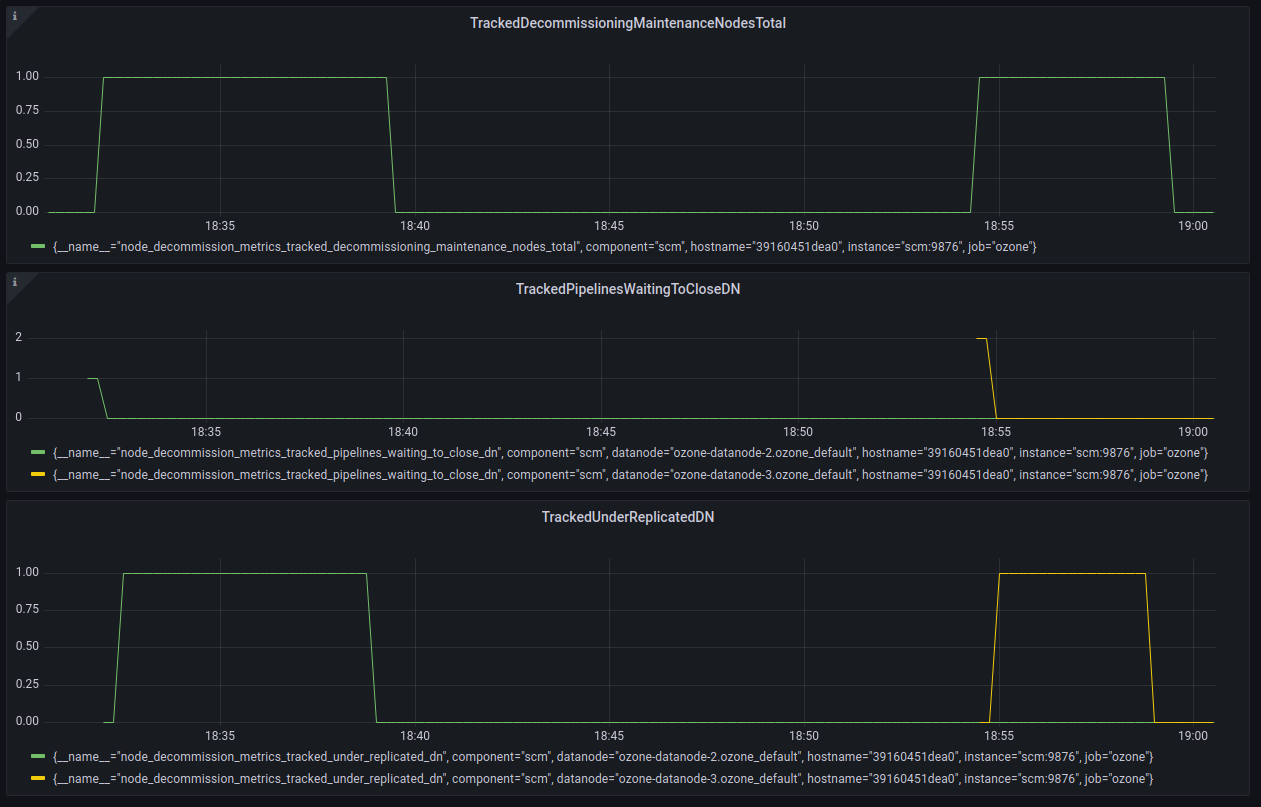
Note filed jira for problem with the master branch for prometheus scraping scm metrics from prom endpoint. This affects our metrics monitoring with prom as well as the scm related metrics such as the scm_node_manager_decommission* metrics. HDDS-7437.
Hi @sodonnel, currently the release of Ozone-1.3 is blocked on this PR. Could you help continue to review this PR?
I'm out of the office this week. I will look at this again on Monday. I don't think this PR is essential for the 1.3 release as we have lived without these metrics up until now.
Thanks @sodonnel for the feedback.
Hi @neils-dev, I saw that you mentioned in the dev email that ozone 1.3 needs this patch. But I agree with Stephen. Current 1.3 release is more focused on the important bug fixes. So I'm going to remove this PR from the 1.3 block list, what do you think?
Hi @captainzmc , thanks for reaching out for this PR to be included in the 1.3 release. This patch is actually something that we would like to have in the 1.3 release. Such functionality is new and needed for our production environment. We would like to use this included in the 1.3 stable release. Please do continue to include this PR in 1.3 release blocked list. @kerneltime, as discussed in our past community call, please do review the changes. @sodonnel please do so when you can. Thanks!
@captainzmc, having visibility on the decommissioning / maintenance process its something quite important from an operational point of view if you want to run a production cluster. Our operational team will be very reluctant to use ozone in prod without that as they will not know what's happening or not. Its probably a fundamental feature from an operational point of view. We want to use the 1.3 version as it will be widely use and not a master branch later. This is why we would like to have it included in the 1.3. Moreover I believe we are not far to be ready, @neils-dev told me that all the comments have been addressed in this PR.
Thanks @neils-dev @michelsumbul for the feedback. I got you point. Sure. let's keep this PR in 1.3 release blocked list.
Now, a single metric name is used for the same metric collected for each datanode, within the metric is an associated tag that identifies the node for the metric reading, ie. `node_decommission_metrics_tracked_sufficiently_replicated_dn{datanode="ozone-datanode-2.ozone_default",hostname="39160451dea0"}.
~~I don't see how in the source code this tag gets set - can you point me at how the tag per DN is getting set please?~~
Sorry, github was showing me the wrong commit (or I was being stupid!). I see it now.
    "tag.datanode.1" : "ozone-datanode-3.ozone_default",
    "tag.Hostname.1" : "39160451dea0",
    "TrackedUnderReplicatedDN.1" : 1,
    "tag.datanode.2" : "ozone-datanode-3.ozone_default",
    "tag.Hostname.2" : "39160451dea0",
    "TrackedSufficientlyReplicatedDN.2" : 0,
    "tag.datanode.3" : "ozone-datanode-3.ozone_default",
    "tag.Hostname.3" : "39160451dea0",
    "TrackedPipelinesWaitingToCloseDN.3" : 0,
    "tag.datanode.4" : "ozone-datanode-3.ozone_default",
    "tag.Hostname.4" : "39160451dea0",
    "TrackedUnhealthyContainersDN.4" : 0
Its a bit strange that we have 4 tags for the same DN. The way I'd expect this to work is we have 1 tag per DN, and then the 4 metrics (under, sufficiently, pipelines, unhealthy) all sharing that tag.
I think this is due to the way you are adding the tags in getMetrics - you are building a new tag per metric, rather than a tag per DN and then tagging all its metrics with that tag.
It might be easier if you simply stored a Set or Map of ContainerStateInWorkflow inside the metrics class, as then you can iterate it on a host by host basis.
Example of what I mean, plus more simplifications - https://github.com/sodonnel/hadoop-ozone/commit/673109c0403c69265fd100499373002e37ddfbc0
Latest push contains both simplification changes to NodeDecommissionMetrics and DatanodeAdminMonitorImpl to use the ContainerStateInWorkflow inner class and methods. Thanks for the suggestion.
Also included is a fix to the jmx by host metrics collected:
The way I'd expect this to work is we have 1 tag per DN, and then the 4 metrics (under, sufficiently, pipelines, unhealthy) all sharing that tag.
example with datanode 1 and datanode 3 in decommissioning workflow as captured by monitor:
    "TrackedPipelinesWaitingToCloseTotal" : 4,
    "TrackedContainersUnderReplicatedTotal" : 0,
    "TrackedContainersUnhealthyTotal" : 0,
    "TrackedContainersSufficientlyReplicatedTotal" : 0,
    "tag.datanode.1" : "ozone_datanode_1.ozone_default",
    "tag.Hostname.1" : "f27febaf1870",
    "TrackedPipelinesWaitingToCloseDN.1" : 2,
    "TrackedUnderReplicatedDN.1" : 0,
    "TrackedSufficientlyReplicatedDN.1" : 0,
    "TrackedUnhealthyContainersDN.1" : 0,
    "tag.datanode.2" : "ozone_datanode_3.ozone_default",
    "tag.Hostname.2" : "f27febaf1870",
    "TrackedPipelinesWaitingToCloseDN.2" : 2,
    "TrackedUnderReplicatedDN.2" : 0,
    "TrackedSufficientlyReplicatedDN.2" : 0,
    "TrackedUnhealthyContainersDN.2" : 0
@sodonnel , for a possible fix for handling prometheus stale metrics, we should open a new jira to flush stale metrics on each refresh write in the PrometheusSink,
https://github.com/apache/ozone/blob/79a9d39da7f33e71bc00183e280105562354cca4/hadoop-hdds/framework/src/main/java/org/apache/hadoop/hdds/server/http/PrometheusMetricsSink.java#L134
The flush of old stale metrics and populating the internal PrometheusMetricsSink Map can be handled similar to a resolved HDFS jira, HADOOP-17804.
Yes it makes sense to open a new Jira for the prometheus issue.
The tagged metrics look better now - we have one tag per DN, which is what I would expect.
Thanks @kerneltime , @sodonnel for the comment on removing the prefix "tracked" from metrics published through the NodeDecommisionMetrics. Sounds good. I've updated the code, now metrics are pushed as for jmx,
"DecommissioningMaintenanceNodesTotal" : 1,
"RecommissionNodesTotal" : 0,
"PipelinesWaitingToCloseTotal" : 1,
"ContainersUnderReplicatedTotal" : 0,
"ContainersUnhealthyTotal" : 0,
"ContainersSufficientlyReplicatedTotal" : 0,
"tag.datanode.1" : "ozone_datanode_2.ozone_default",
"tag.Hostname.1" : "30857068c05f",
"PipelinesWaitingToCloseDN.1" : 1,
"UnderReplicatedDN.1" : 0,
"SufficientlyReplicatedDN.1" : 0,
"UnhealthyContainersDN.1" : 0
and on the prom endpoint,
node_decommission_metrics_containers_under_replicated_total{hostname="30857068c05f"} 1 ... node_decommission_metrics_decommissioning_maintenance_nodes_total gauge node_decommission_metrics_decommissioning_maintenance_nodes_total{hostname="30857068c05f"} 1
Latest changes look good. Please have a check @kerneltime and we can commit if you are happy.
Thanks @neils-dev for the patch, and thanks @sodonnel @kerneltime for the review, let's merge this.