Constant Throughput Timer : 0 TPS + shared algorithm + thread lifetime runs all Threads - 1
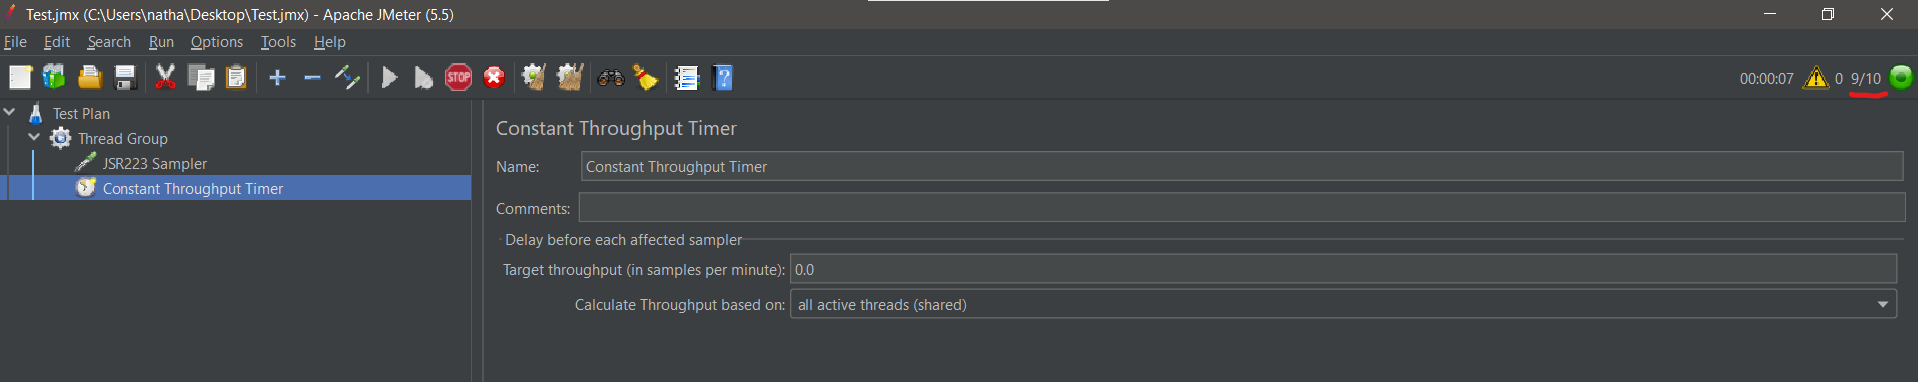
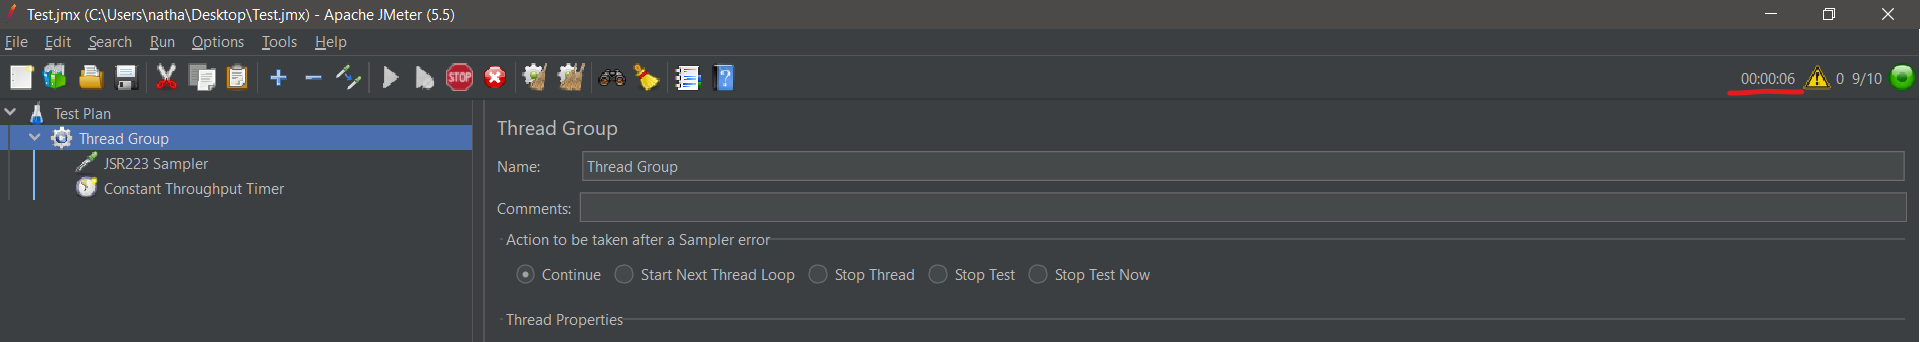
nathan88wise (Bug 66237): When I specify 0 for the "Target throughput (in sample per minute)" of a Constant Throughput Timer, use either shared algorithm - "all active threads (shared)" or "all active threads in current thread group (shared)" and have a Thread Lifetime specified - the Thread Group will run with <"Number of Threads" - 1> threads.
When using other algorithms in the Constant Throughput Timer, the test will instead stop as expected. Not sure why the shared algorithms should differ; I'm assuming this is a bug.
Created attachment Test.jmx: Example file where the bug occurs
Test.jmx
<?xml version="1.0" encoding="UTF-8"?>
<jmeterTestPlan version="1.2" properties="5.0" jmeter="5.5">
  <hashTree>
    <TestPlan guiclass="TestPlanGui" testclass="TestPlan" testname="Test Plan" enabled="true">
      <stringProp name="TestPlan.comments"></stringProp>
      <boolProp name="TestPlan.functional_mode">false</boolProp>
      <boolProp name="TestPlan.tearDown_on_shutdown">true</boolProp>
      <boolProp name="TestPlan.serialize_threadgroups">false</boolProp>
      <elementProp name="TestPlan.user_defined_variables" elementType="Arguments" guiclass="ArgumentsPanel" testclass="Arguments" testname="User Defined Variables" enabled="true">
        <collectionProp name="Arguments.arguments"/>
      </elementProp>
      <stringProp name="TestPlan.user_define_classpath"></stringProp>
    </TestPlan>
    <hashTree>
      <ThreadGroup guiclass="ThreadGroupGui" testclass="ThreadGroup" testname="Thread Group" enabled="true">
        <stringProp name="ThreadGroup.on_sample_error">continue</stringProp>
        <elementProp name="ThreadGroup.main_controller" elementType="LoopController" guiclass="LoopControlPanel" testclass="LoopController" testname="Loop Controller" enabled="true">
          <boolProp name="LoopController.continue_forever">false</boolProp>
          <intProp name="LoopController.loops">-1</intProp>
        </elementProp>
        <stringProp name="ThreadGroup.num_threads">10</stringProp>
        <stringProp name="ThreadGroup.ramp_time">1</stringProp>
        <boolProp name="ThreadGroup.scheduler">true</boolProp>
        <stringProp name="ThreadGroup.duration">300</stringProp>
        <stringProp name="ThreadGroup.delay"></stringProp>
        <boolProp name="ThreadGroup.same_user_on_next_iteration">true</boolProp>
      </ThreadGroup>
      <hashTree>
        <JSR223Sampler guiclass="TestBeanGUI" testclass="JSR223Sampler" testname="JSR223 Sampler" enabled="true">
          <stringProp name="cacheKey">true</stringProp>
          <stringProp name="filename"></stringProp>
          <stringProp name="parameters"></stringProp>
          <stringProp name="script">return;</stringProp>
          <stringProp name="scriptLanguage">groovy</stringProp>
        </JSR223Sampler>
        <hashTree/>
        <ConstantThroughputTimer guiclass="TestBeanGUI" testclass="ConstantThroughputTimer" testname="Constant Throughput Timer" enabled="true">
          <intProp name="calcMode">3</intProp>
          <doubleProp>
            <name>throughput</name>
            <value>0.0</value>
            <savedValue>0.0</savedValue>
          </doubleProp>
        </ConstantThroughputTimer>
        <hashTree/>
      </hashTree>
    </hashTree>
  </hashTree>
</jmeterTestPlan>
Severity: normal OS: All
nathan88wise (migrated from Bugzilla): Created attachment Sample.png: Showing where Thread issue occurs
nathan88wise (migrated from Bugzilla): Also - just a few clarifications:
- This happens with other samplers. I tried with a JMS publisher and a Dummy Sampler (plugin)
- It still occurs when Loop Count isn't set to infinite. Seems to be as long as a Thread duration is provided