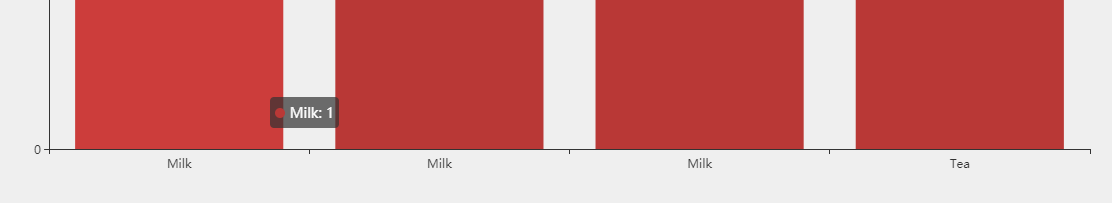
使用dataset ,维度相同的数据会在X轴重叠
如图所示,我如果使用encode,以’product‘为X轴,“2016”为Y轴的话,维度相同的数据就会重叠。
有没有什么方法可以让相同维度的数据相加。因为实际项目中涉及的数据量很大,循环相加并不是好的解决方法

我也想知道这个问题怎么解决。
使用xAxis.data和series[i].data来指定xAxis的label是允许重复的。
所以现在的行为看起来像是一个bug。
建议提供参数来控制:
- 把x轴label相同的柱子的值相加,只显示一个相同的label
- 平铺开
@Mignon-han 我也觉得维度值重复时,使用dataset的方式和之前直接设置series的行为应该保持一致,目前项目升级到dataset之后也遇到了这个问题
@elephantme 我暂时放弃升级了。我之前有在data中给每一个柱子单独设置颜色。 这在dataset里面显然无法实现。echarts的开发人员告诉我可以用visiualMap来实现。但是我尝试了多次,还是没法实现。
我也想知道这个问题怎么解决。 使用
xAxis.data和series[i].data来指定xAxis的label是允许重复的。 所以现在的行为看起来像是一个bug。建议提供参数来控制:
1. 把x轴label相同的柱子的值相加,只显示一个相同的label

2. 平铺开
这个问题解决了吗?我也碰到了
I think there is no ECharts issue here and nothing to be fixed.
A category axis expects unique values, duplicates will not show separate. Duplicates are exceptions and need to be taken care upfront, through a preprocessing step. One option is to transform duplicates into unique - Demo Code. Another is to add values of duplicates into a single value sum.
从xAxis/yAxis直接赋值data改为dataset后我也遇到了,没想到这个问题这么早就出现了。想通过名称做富文本,改变名称就没法映射对应的图片了。
I want to make rich text by name, but I can't map the corresponding picture after changing the name.
any code example? It's hard to have automatic rich text format by name because rich names cannot include spaces like data names.
I want to make rich text by name, but I can't map the corresponding picture after changing the name.
any code example? It's hard to have automatic rich text format by name because rich names cannot include spaces like data names. Thank you for your reply.I have been sovle this porblem.Demo Code