[Bug] Empty chart traces on conversion to PNG
Version
5.4.1
Link to Minimal Reproduction
The dataset too large to get setup
Steps to Reproduce
// fcs is a json object
// pid, idx are params passed to select arrays from a matrix

var chart = echarts.init(document.getElementById(pid), 'shine');
window.onresize = function () {
  chart.resize();
};

chart.setOption({
  backgroundColor: 'transparent',
  brush: {
    brushMode: 'multiple',
    removeOnClick: false,
    brushStyle: { borderWidth: 2, borderColor: 'red' },
    toolbox: ['rect', 'polygon', 'lineX', 'lineY', 'keep', 'clear']
  },
  dataset: {
    source: [fcs.Parameters[idx0].Values, fcs.Parameters[idx1].Values]
  },
  xAxis: {
    type: 'value',
    min: 0,
    max: fcs.Parameters[idx0].Range,
    name: fcs.Parameters[idx0].Name,
    nameLocation: 'middle',
    nameGap: 25,
    axisTick: { length: 3 },
    axisLabel: { margin: 4 },
    nameTextStyle: { fontWeight: 'bold' }
  },
  yAxis: {
    type: 'value',
    min: 0,
    max: fcs.Parameters[idx1].Range,
    name: fcs.Parameters[idx1].Name,
    nameLocation: 'middle',
    nameGap: 30,
    axisTick: { length: 3 },
    axisLabel: { margin: 4 },
    nameTextStyle: { fontWeight: 'bold' }
  },
  series: [
    {
      type: 'scatterGL',
      symbolSize: 2,
      symbol: 'circle',
      seriesLayoutBy: 'row',
      animation: false,
      itemStyle: { color: randDarkColor() }
    }
  ]
});
Current Behavior
An empty chart on export to png.
Expected Behavior
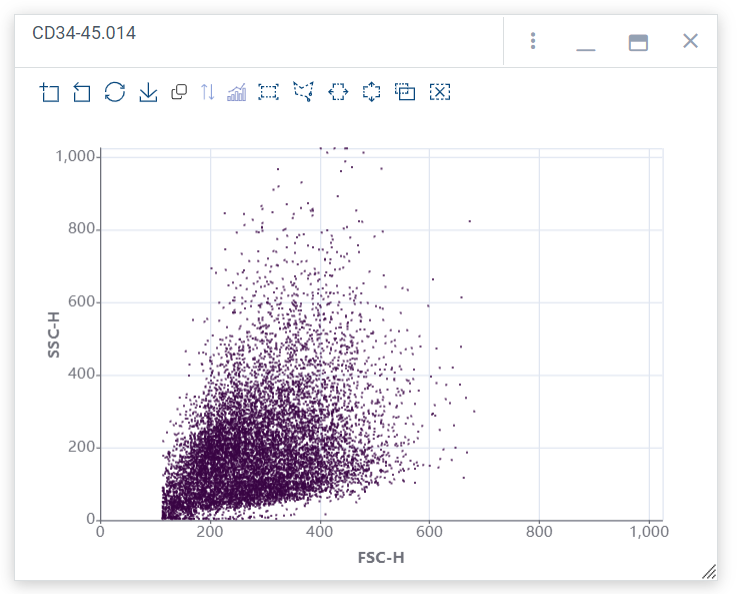
What happened to the trace. Just used the toolbar button for export to PNG.
Environment
- OS:win 10 prof
- Browser: Firefox 111.0.1
- Framework: native js
Any additional comments?
No response
yes, bug in toolbox.feature.saveAsImage for scatterGL. Points are shifted 50% to the right.
Demo Code
NB: @stormbinary, next time please provide valid Minimal Reproduction like Demo Code above.
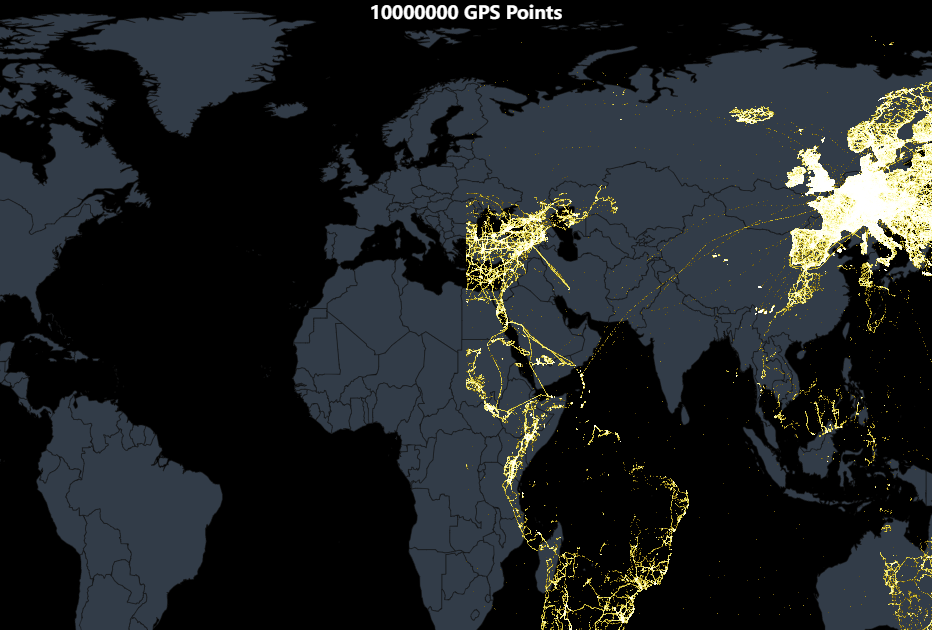
Previous example was with coordinateSystem: 'geo'. This one is with coordinateSystem: 'cartesian2d'.
Same result - points are shifted to the right in the output PNG. No difference with JPG format.
Demo Code
OK. Now that this bug has been reproduced. Is there a workaround for it?
@stormbinary, the workaround is to switch to type: 'scatter' instead of scatterGL, if possible.
The problem is with echarts-gl.
SVG would have been an option, but echarts-gl cannot draw on SVG: TypeError: n.painter.isSingleCanvas is not a function
If someone has bumped with problem, he can try this solution. (because echarts-gl lib seems not supported). Generally echarts-gl creates their own canvas for presentation data. So idea is to grab data from normal echart-js (coordinates, etc. ) and chart data from echart-gl, and merge them together.
I applied some custom function for save image with MY prefix
tooltip: {
  mySaveAsImage:  {
     name: "NAME",
     icon: "M4.7,22.9L29.3,45.5L54.7,23.4M4.6,43.6L4.6,58L53.8,58L53.8,43.6M29.2,45.1L29.2,0",
     title: "save as image",
     show: true,
     onclick: () => {
            const chartBase64 = chart.getDataURL({ excludeComponents: ["toolbox", "dataZoom"],});
            const chartImg = new Image();
            chartImg.src = chartBase64;

            const glCanvas = chart.getDom().childNodes[0].children[1];   //<-- getting `chart-gl` canvas by chart.js api
            // const glCanvas = document.getElementsByTagName("canvas")[1]; //<--  getting `chart-gl` canvas by DOM
            const glBase64 = glCanvas.toDataURL();
            const glImg = new Image();
            glImg.src = glBase64;

            const width = chart.getWidth();
            const height = chart.getHeight();

            const canvas = document.createElement("canvas");
            canvas.height = height;
            canvas.width = width;
            const ctx = canvas.getContext("2d");

            glImg.onload = function () { // wait when last image was loaded
              ctx.drawImage(chartImg, 0, 0, width, height);
              ctx.drawImage(glImg, 0, 0, width, height);
              const dataURL = canvas.toDataURL();
              onSaveAsImage(dataURL, "fila name");
            };
       },
   },

 // Possible save image function
 const onSaveAsImage = (imgSrc, name) => {
    const link = document.createElement("a");
    link.setAttribute("target", "_blank");
    link.setAttribute("href", `${imgSrc}`);
    link.setAttribute("download", `${name}.png`);
    link.style.display = "none";
    document.body.appendChild(link);
    link.click();
    document.body.removeChild(link);
 };
Seems like canvas image in the scatter-GL is depend on the title position. Workaround - you can try add fake last title into your config with strict position. Works only if you use subtext It helped me:
title:  [
   // your labels
 {
   top: -5,
   left: -5,
   subtext: 'fix echart-gl bug',
   subtextStyle: {
       color: 'rgba(255, 0, 0, 0)'  // hide text
    }
 }
]
@AndreyPatseiko, great workaround 🥇
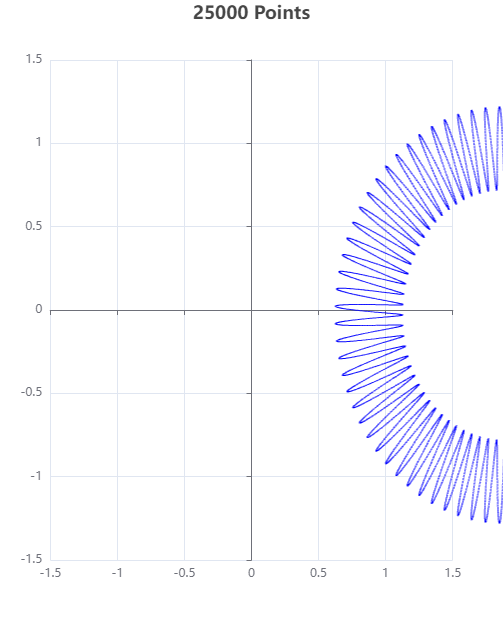
I experimented with your code and changed offsets from pixels to percentages to make it responsive. The "magic offset" on both axis seems to be around -5.8% - Demo Code.
So the position is good now, but there is also some scaling which will be difficult to outmaneuver.
The 4 red dots should be at 1 unit distance from center, but they are not.