How to overall scale graph chart? 如何整体缩放关系图
Version
5.3.3
Link to Minimal Reproduction
No response
Steps to Reproduce
关系图默认可以通过scaleLimit,roam,nodeScaleRatio等参数控制缩放,但是如何做到类似浏览器缩放的整体缩放效果?
例如
graph chart can use parameters such as scaleLimit,roam,nodeScaleRatio for scaling by default, but how to achieve an overall zoom effect similar to browser zoom?
e.g.


Environment
- OS:
- Browser:
- Framework:
Any additional comments?
No response
问题反馈2: 在配置links下的label的show为true是,此时开启labelLayout.hideOverlap,会出现线上文字无法跟随拖动的情况,例子可以使用https://echarts.apache.org/examples/zh/editor.html?c=graph-simple 添加labelLayout后直接复现 problem feedback2: when i set links[i].label.show = true and labelLayout.hideOverlap at the same time,the edge text will not move with the chart example
问题反馈3:如何配置label的z或者z2或者zlevel?在开启线上文字之后,根据渲染先后顺序,会导致文字的层级在原点之上,发生重叠
problem feedback3: how to config label z or z2 or zlevel? when i open edge label text,according to the rendering order, the text level will overlap above the node
 通过zr.storage.getDisplayList(true, true),然后对TSpan元素进行attr('z',99)或者attr('z2')或者attr('zlevel')均不生效
i can get text node by zr.storage.getDisplayList(true, true),but attr('z') or attr('z2') or attr('zlevel') not work
通过zr.storage.getDisplayList(true, true),然后对TSpan元素进行attr('z',99)或者attr('z2')或者attr('zlevel')均不生效
i can get text node by zr.storage.getDisplayList(true, true),but attr('z') or attr('z2') or attr('zlevel') not work
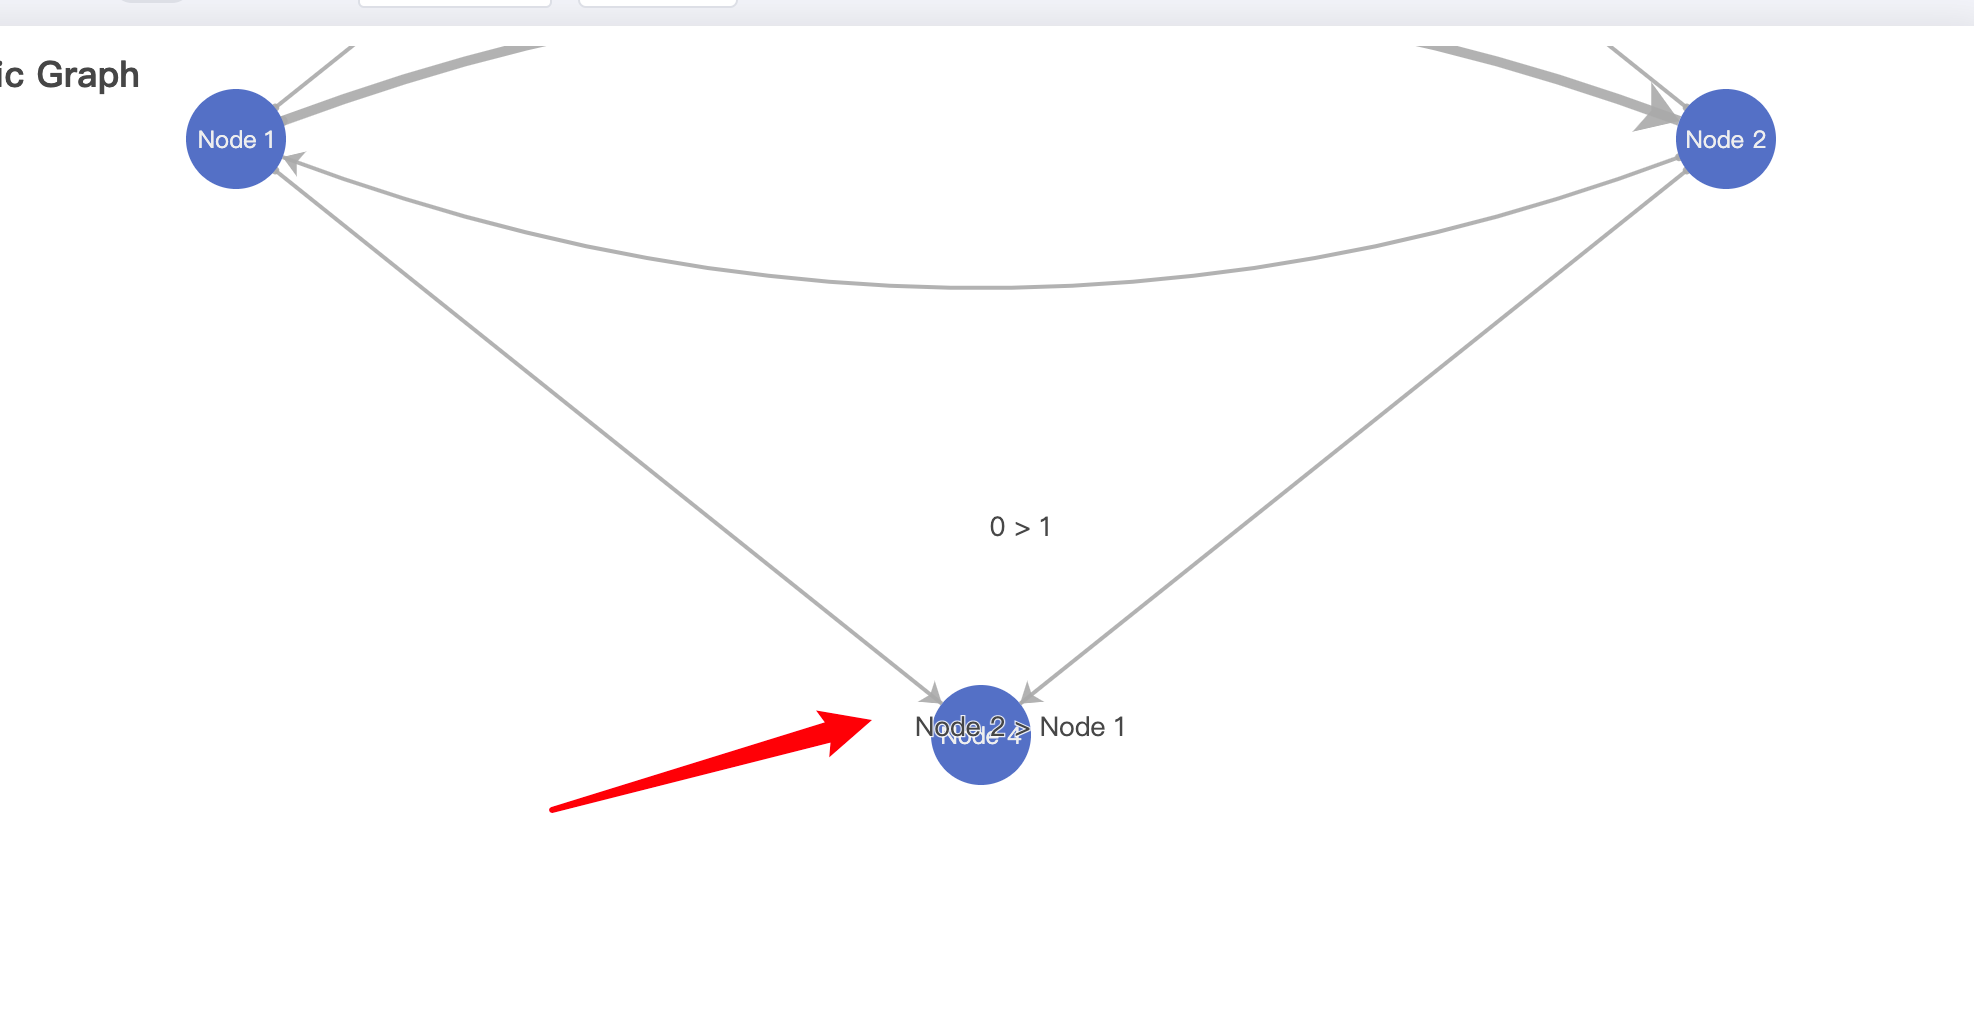
use this example, and move "Node 4" to edge text "Node 2 > Node 1" the problem can be reproduced, example
Did you try the obvious dataZoom: {inside: {type: 'inside'}} ?
Without Minimal Reproduction code it is hard to debug...
dataZoom: {inside: {type: 'inside'}}
it can not work. about Minimal Reproduction code, can use any code in https://echarts.apache.org/examples/zh/index.html#chart-type-graph, i think it is a common problem. when i zoom a graph chart, it is not global scale(scale all canvas), just scale some part,for example, i can not scale label text or lineWith(border). so,Is there a way to scale the entire canvas?(It's like scaling group in zrender)
@Yijx Hi, you can get the current zoom of the graph chart and scale it manually. Please refer to this demo.
yep, @plainheart is one step ahead, while I was typing :-)
the right code ...and to zoom for the edges add lineStyle: { width: 2.5 * currentZoom }
@Yijx Hi, you can get the current zoom of the graph chart and scale it manually. Please refer to this demo.
thanks, but I tried this method before.If i use this way, i must set a new option to echarts,but if i use force layout and not set x and y(use default position),echarts will recalculate the position.This can cause uncontrolled movement of the node example
@Yijx Hi, you can get the current zoom of the graph chart and scale it manually. Please refer to this demo.
Of course, I have a solution to the above problem, that is, to modify the text and border through the zrender instance, which will not cause the ECharts to recalculate the layout,but this brings a new problem. When the mouse moves on the circle to zoom,borderWidth will not computed right.example
correct situation:
 problematic situation:

This issue has been automatically marked as stale because it did not have recent activity. It will be closed in 7 days if no further activity occurs. If you wish not to mark it as stale, please leave a comment in this issue.
This issue has been automatically closed because it did not have recent activity. If this remains to be a problem with the latest version of Apache ECharts, please open a new issue and link this to it. Thanks!