can support bar base like plotly?
What problem does this feature solve?
can support feature like plotly?
1.bar with base
2.auto set y aixs bound
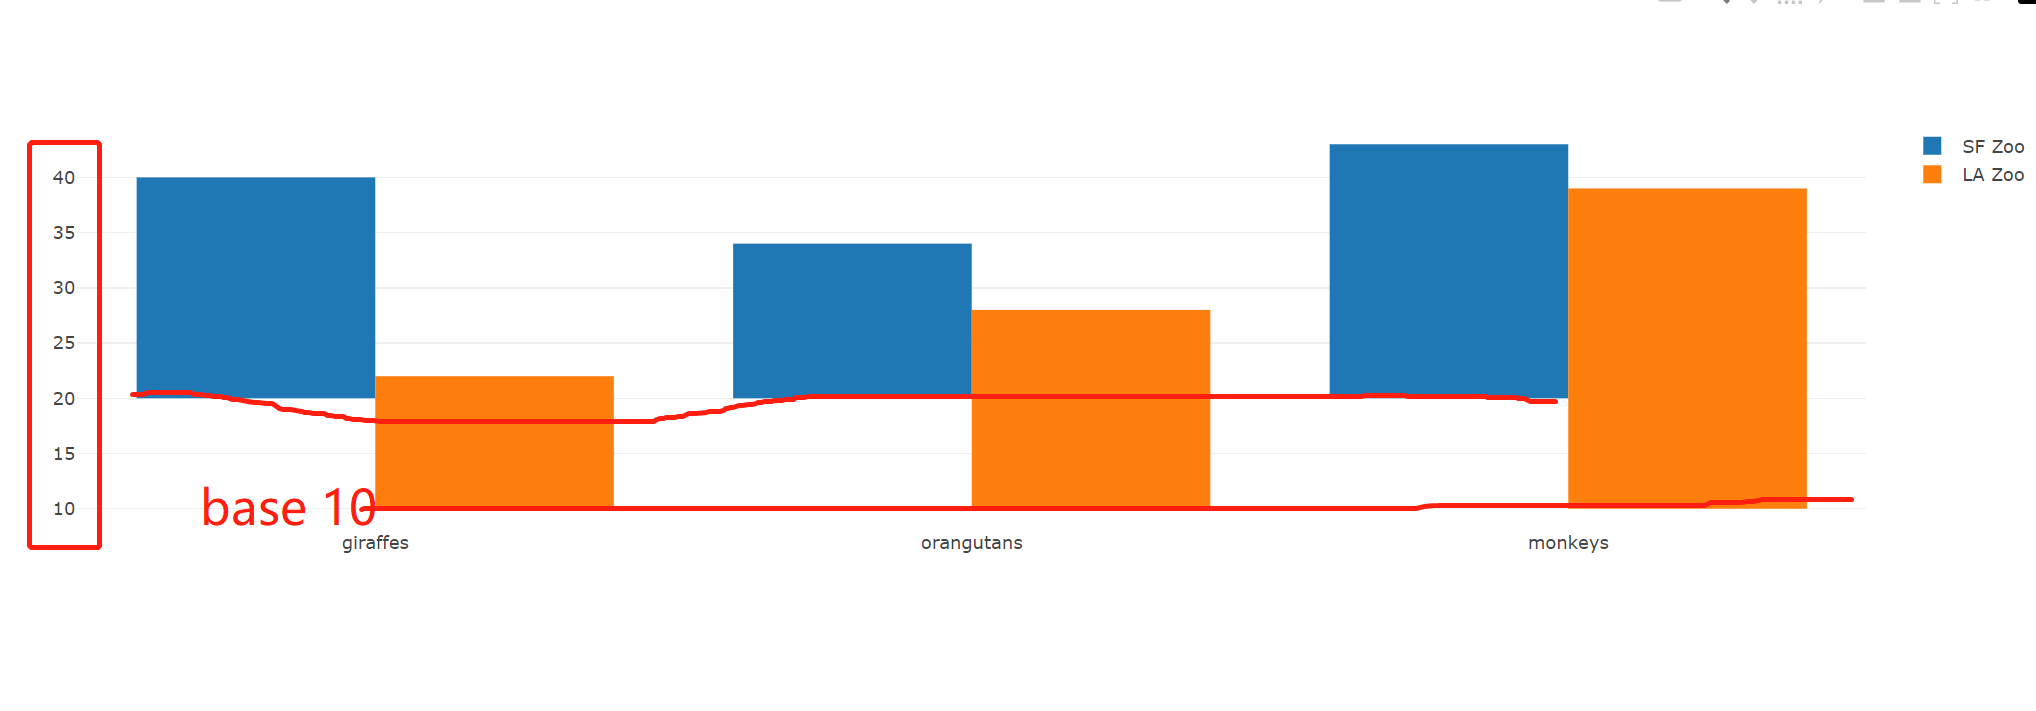
· var trace1 = { x: ['giraffes', 'orangutans', 'monkeys'], y: [20, 14, 23], base:20, name: 'SF Zoo', type: 'bar' };
var trace2 = { x: ['giraffes', 'orangutans', 'monkeys'], y: [12, 18, 29], name: 'LA Zoo', base:10, type: 'bar' };
var data = [trace1, trace2];
var layout = {barmode: 'group'};
Plotly.newPlot('myDiv', data, layout); `
What does the proposed API look like?
easy use
This issue has been automatically marked as stale because it did not have recent activity. It will be closed in 7 days if no further activity occurs. If you wish not to mark it as stale, please leave a comment in this issue.
This issue has been automatically closed because it did not have recent activity. If this remains to be a problem with the latest version of Apache ECharts, please open a new issue and link this to it. Thanks!