fix(axis): fix `axis.nameTextStyle.overflow` option not working
Brief Information
This pull request is in the type of:
- [x] bug fixing
- [ ] new feature
- [ ] others
What does this PR do?
Make the Axis.nameTextStyle.overflow option work and add TypeScript types for Axis.nameTextStyle.overflow and Axis.nameTextStyle.ellipsis
Fixed issues
- #17180
- #17209
Details
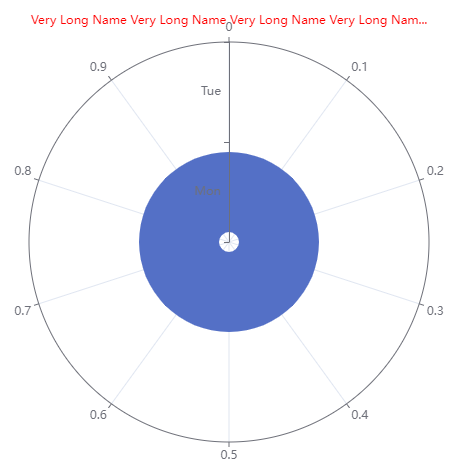
Before: What was the problem?
Axis.nameTextStyle.overflow option does not work
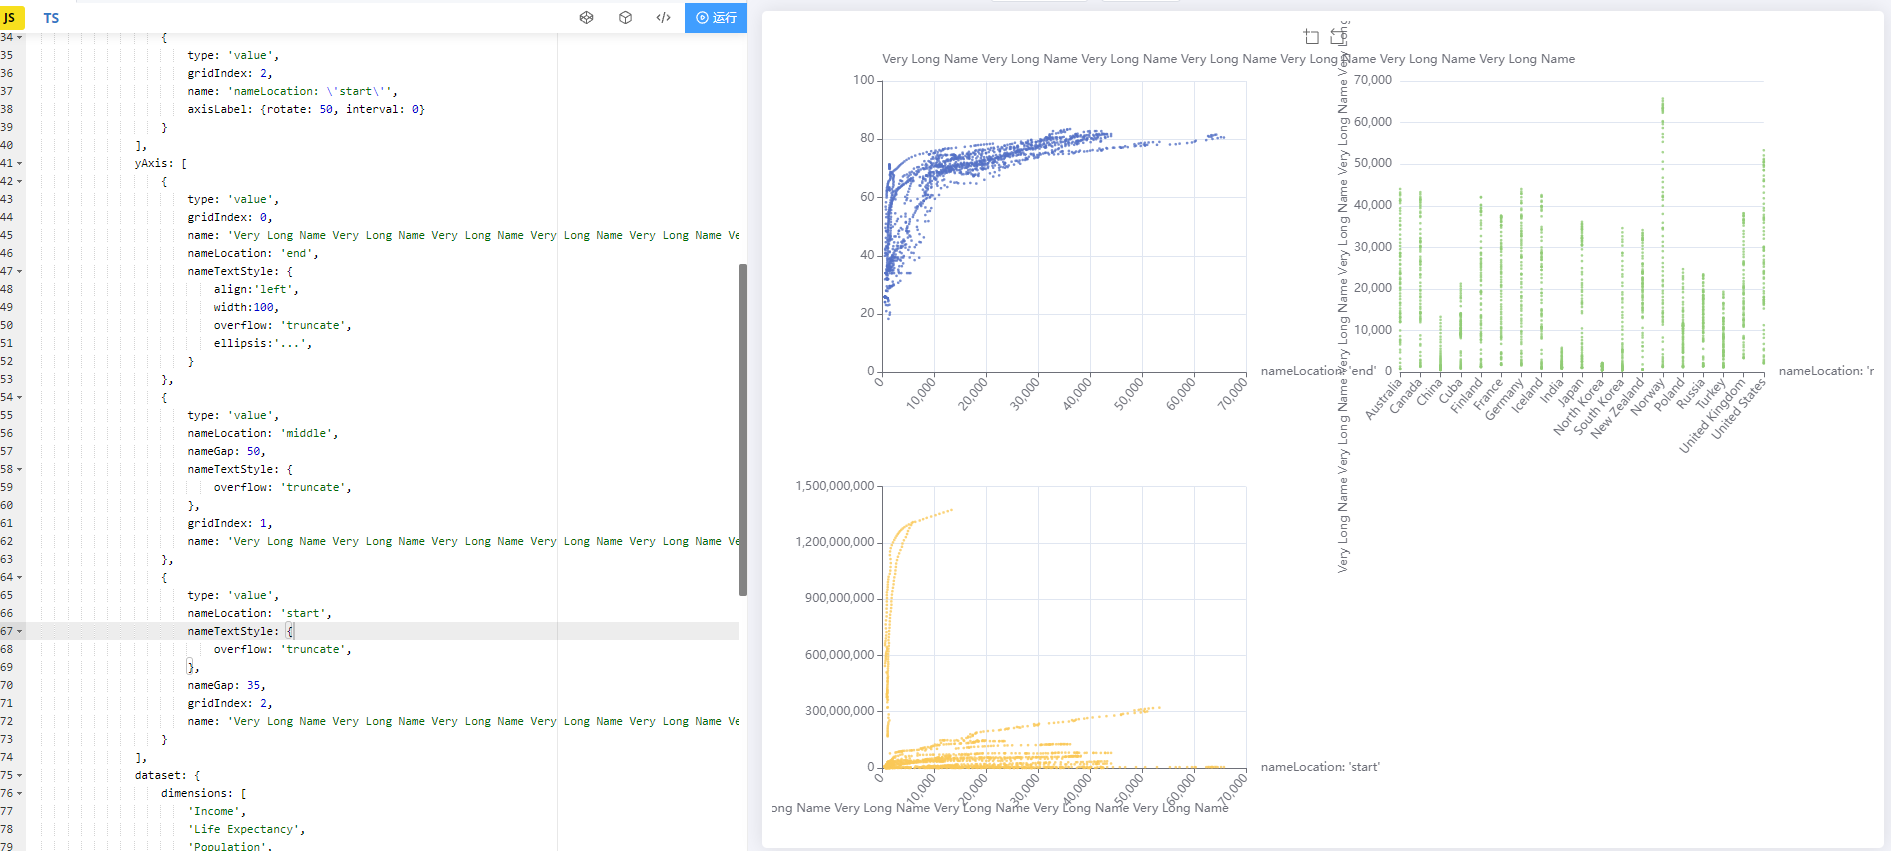
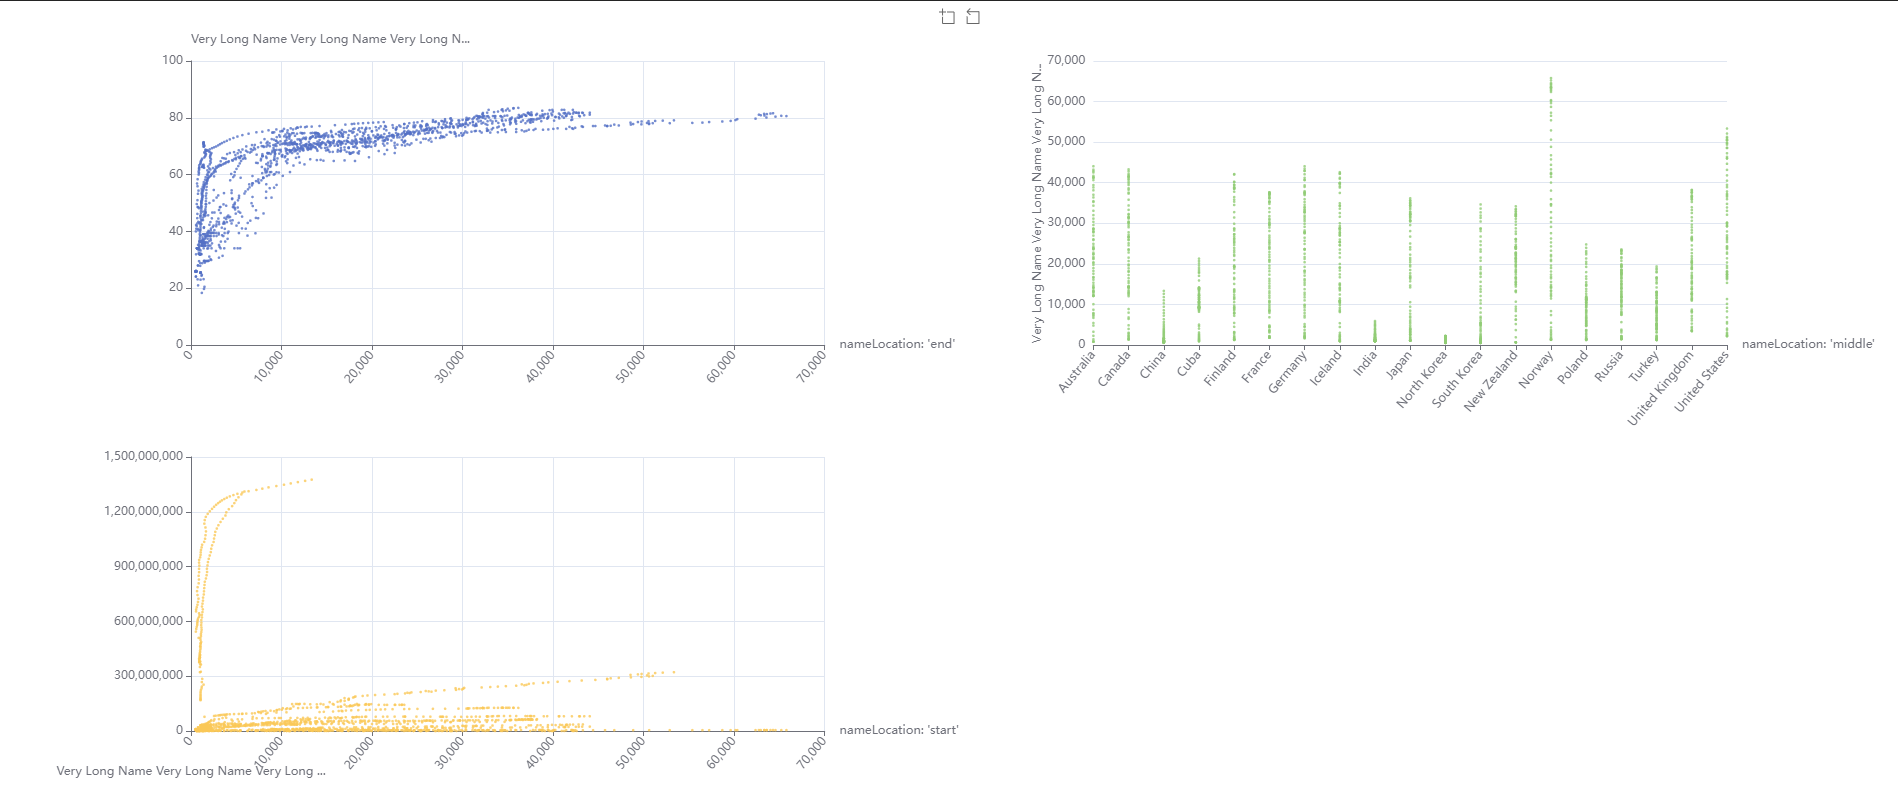
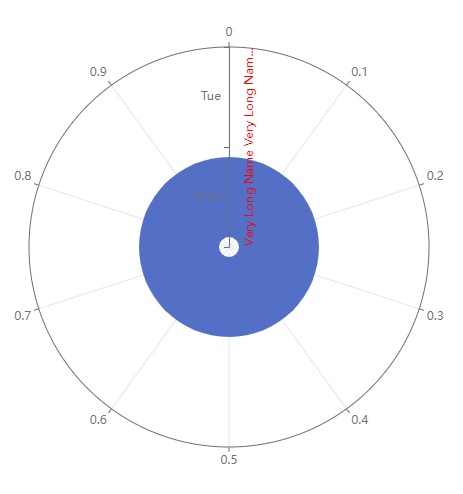
After: How does it behave after the fixing?
Document Info
One of the following should be checked.
- [x] This PR doesn't relate to document changes
- [ ] The document should be updated later
- [ ] The document changes have been made in apache/echarts-doc#xxx
Misc
ZRender Changes
- [ ] This PR depends on ZRender changes (ecomfe/zrender#xxx).
Related test cases or examples to use the new APIs
test/axis-name2.html
Others
Merging options
- [x] Please squash the commits into a single one when merging.
Other information
@MicroLightAzaf Please also help test if this fixes #17209 , especially if extent[1] - extent[0] is correct.
@MicroLightAzaf Please also help test if this fixes #17209 , especially if
extent[1] - extent[0]is correct.
@Ovilia Also fixes #17209, I've added it to the test case.
Please add different values of
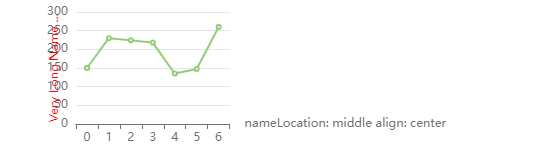
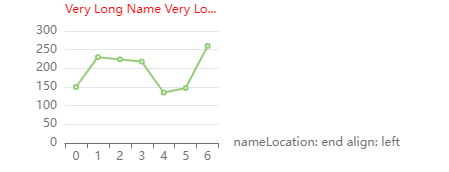
nameTextStyle.alignin the test cases. I think the logic is still not correct. For example, whenalign: left, it is like this now, which I think the constraining width is too small.
BTW, I think you don't have to use so many data in the test cases since they are designed to test the axis names rather than the scatter series. Minify the data can make the test code to be cleaner and easier to debug. You can use the data like this one.
Thanks for the guidance! I minified the data for the test case and added different test parameters for nameTextStyle.align.
In the example you mentioned, what is truncated is probably the yAxis axis name, so the length of the yAxis is used for truncation.
Maybe you meant that it would be better to follow the direction of the text to determine the default truncation length?
Maybe you meant that it would be better to follow the direction of the text to determine the default truncation length?
Yes. Thanks!
Now name will truncate according to the nameLocation option to determine whether to use the width or its axis length and for charts that don't get a bounding rectangle (like radar and polar), use two times the axis length (diameter)
This PR has been automatically marked as stale because it has not had recent activity. It will be closed in 7 days if no further activity occurs. If you wish not to mark it as stale, please leave a comment in this PR. We are sorry for this but 2 years is a long time and the code base has been changed a lot. Thanks for your contribution anyway.
This PR has been automatically closed because it has not had recent activity. Sorry for that and we are looking forward to your next contribution.