fix(dataZoom): detail shape is not the same as data with value axis
Brief Information
This pull request is in the type of:
- [x] bug fixing
- [ ] new feature
- [ ] others
What does this PR do?
The detail view in the dataZoom was not the same as the data in range, like:
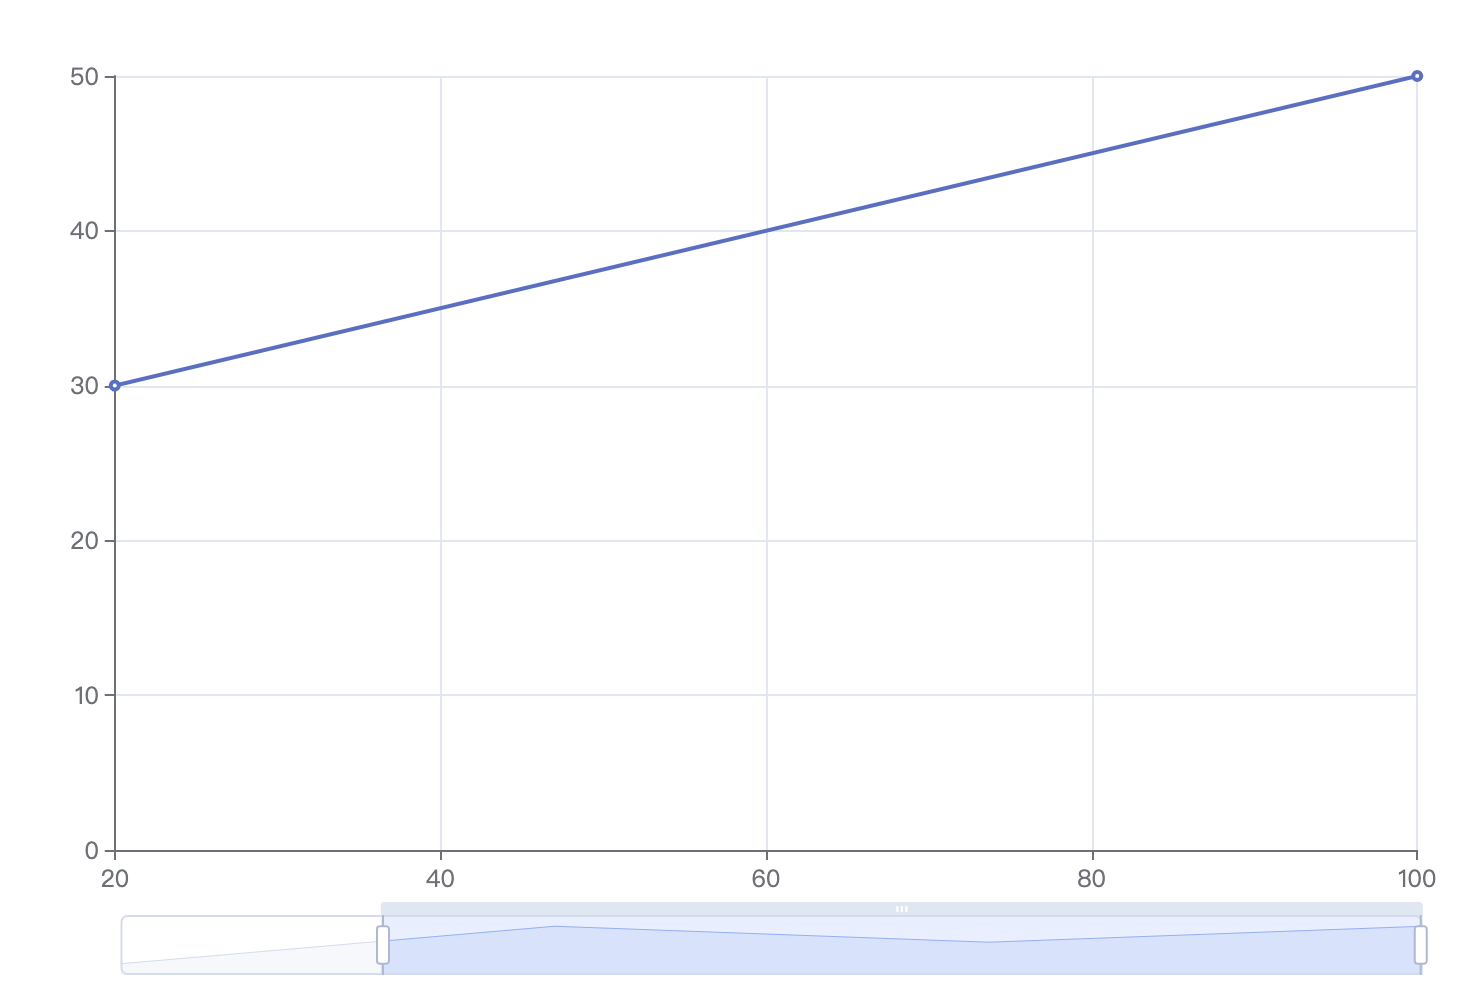
In this case, we can see that there are three data points in the dataZoom detail view but only two points in the visible area of the grid.
Why is this PR necessary
The reason why the detail view should be relative to the visible data is that when user changes the range of the dataZoom, the detail view is servered as an important clue and it is confusing to have the two thing being different.
Fixed issues
- #17141
Details
Before: What was the problem?
The detail view is not the same as the grid area if the axis is a value type.
The main reason for this problem is that, currently, the x position of a horizontal detail region is decided only by the index of data, rather than the x position of the data, similar for y. As a result, the horizontal distance between each points are equal rather than decided by data, and this is the main reason it's different from that in the series.
After: How is it fixed in this PR?
The detail view should be the same as the grid area. So in this PR, I fixed the points in the detail view such that its position is decided by the data in the series rather than data index.
Here are some known differences after this PR:
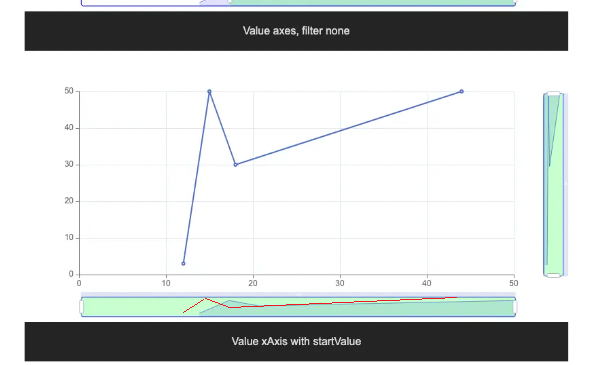
Case 1: Two value axes for a line series
When the line series has two value axes, the horizontal dataZoom detail view should be consistant with that in the grid area.
option = {
    xAxis: {
        type: 'value'
    },
    yAxis: {
        type: 'value'
    },
    series: [
        {
        data: [
            [12, 3],
            [15, 50],
            [18, 30],
            [44, 50]
        ],
        type: 'line'
        }
    ],
    dataZoom: getDataZoom({
        startValue: 15,
    })
};
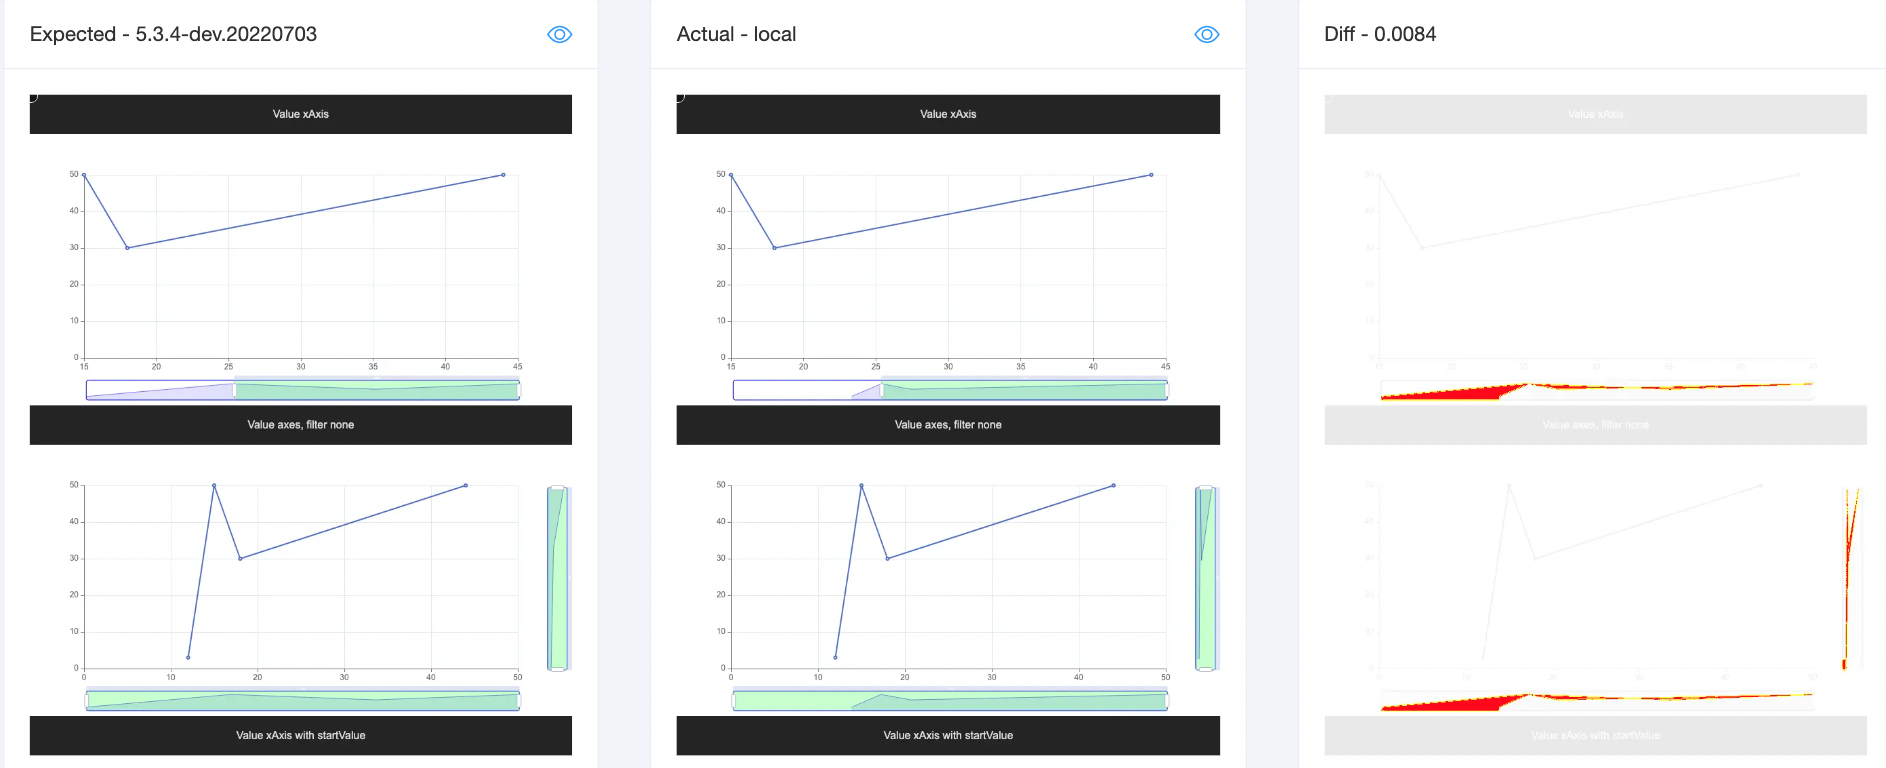
The selected area of the dataZoom detail view (green) should be consistant with the line series in the visible grid area.
Please also note that the vertical dataZoom detail views in the second row have changed to be more informative. In the previous implementation (left), the user may get confused about the vertical detail, but in the new implementation (right), the shape in the detail is consistant with the line series (although the areaStyle should be applied from the bottom rather than top).
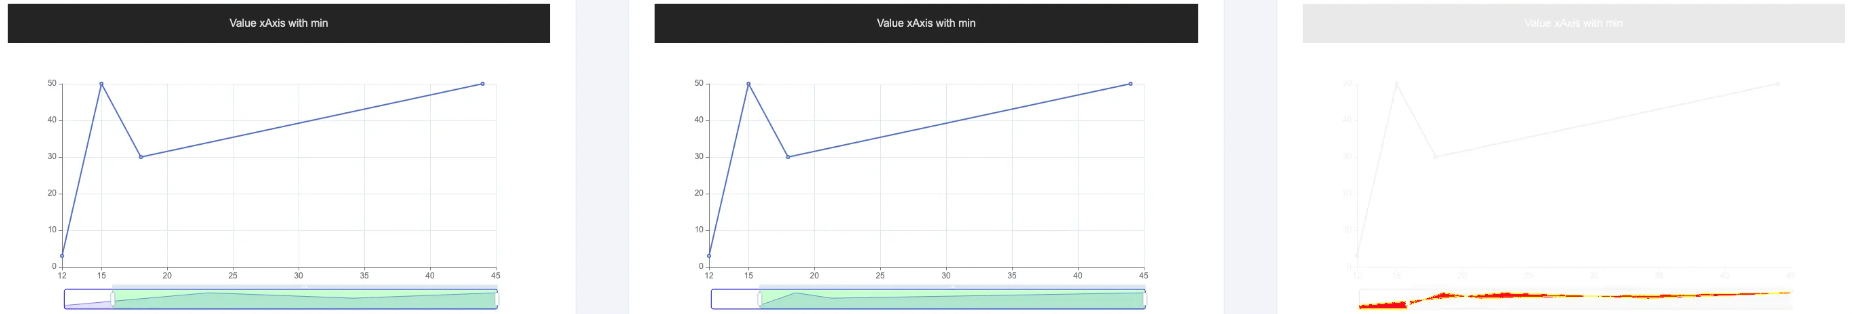
Case 2: When min/max is provided
When axis min/max is provided, the starting/ending value of the detail view should also be min/max rather than data range.
option = {
    xAxis: {
        type: 'value',
        min: 8
    },
    yAxis: {
        type: 'value'
    },
    series: [
        {
        data: [
            [-12, 3],
            [15, 50],
            [18, 30],
            [44, 50]
        ],
        type: 'line'
        }
    ],
    dataZoom: getDataZoom({
        startValue: 12
    })
};
Case 3: Scatter series
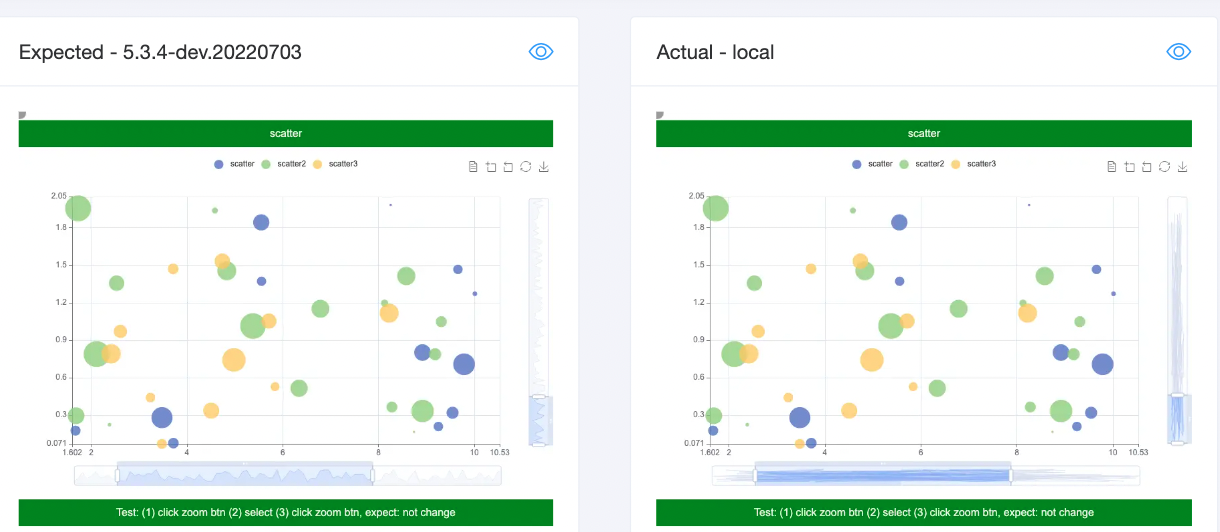
I think the old design (left) is not very informative because it's very confusing how the lines in the detail view relates to scatter series.
But this PR (right) also have problem with scatter series for now because it connects from the first data to the last data using lines in the detail view. This causes the scatter detail to be messy. Maybe it's better to let the series to decide how the detail view looks? I would suggest using the same scatter radius in the detail view because otherwise small scatters may not be visible in the detail view.
Misc
- [ ] The API has been changed (apache/echarts-doc#xxx).
- [ ] This PR depends on ZRender changes (ecomfe/zrender#xxx).
Related test cases or examples to use the new APIs
N.A.
Others
Merging options
- [ ] Please squash the commits into a single one when merging.
Other information
Thanks for your contribution! The community will review it ASAP. In the meanwhile, please checkout the coding standard and Wiki about How to make a pull request.
The pull request is marked to be PR: author is committer because you are a committer of this project.
To reviewers: If this PR is going to be described in the changelog in the future release, please make sure this PR has one of the following labels: PR: doc ready, PR: awaiting doc, PR: doc unchanged
This message is shown because the PR description doesn't contain the document related template.
@Ovilia does this also address stacked bar charts being rendered as a data shadow?
@ianschmitz Current detail view for the stacked bars are not correct because only the first series is considered. I'm not sure this should be included in this PR. I will see if it can be fixed.
@Ovilia Thank you for having a look into this issue.
Your fix breaks the dataZoom panels when nullish data is involved.
null as x value breaks the x-axis zoom panel.
null as y value breaks the y-axis zoom panel.
Also for undefined, '-'
master branch
fix-17141 branch
TestFile
<!DOCTYPE html>
<html>
<head>
    <meta charset="utf-8">
    <meta name="viewport" content="width=device-width, initial-scale=1"/>
    <script src="lib/simpleRequire.js"></script>
    <script src="lib/config.js"></script>
    <script src="lib/jquery.min.js"></script>
    <script src="lib/facePrint.js"></script>
    <script src="lib/testHelper.js"></script>
    <link rel="stylesheet" href="lib/reset.css"/>
</head>
<body>
<style>
</style>

<script>
    const dataNoneLinear = [
        [0, 10],
        [10, 0],
        [80, 1],
        [100, 15],
    ];
    const dataNoneLinearWithNull = [
        [0, 10],
        [10, 0],
        [null, 1],
        [100, null],
    ];

    const dataTimeNoneLinear = [
        [(new Date("07/05/2023 10:00:00")).getTime(), (new Date("07/05/2023 10:00:00")).getTime()],
        [(new Date("07/05/2023 11:00:00")).getTime(), (new Date("07/05/2023 00:00:00")).getTime()],
        [(new Date("07/05/2023 18:00:00")).getTime(), (new Date("07/05/2023 01:00:00")).getTime()],
        [(new Date("07/05/2023 20:00:00")).getTime(), (new Date("07/05/2023 15:00:00")).getTime()],
    ];
    const dataTimeNoneLinearWithNull = [
        [(new Date("07/05/2023 10:00:00")).getTime(), (new Date("07/05/2023 10:00:00")).getTime()],
        [(new Date("07/05/2023 11:00:00")).getTime(), (new Date("07/05/2023 00:00:00")).getTime()],
        [null, (new Date("07/05/2023 01:00:00")).getTime()],
        [(new Date("07/05/2023 20:00:00")).getTime(), null],
    ];

    const charts = [
        {id: '01', type: 'line', axisType: 'category', data: dataNoneLinear},
        {id: '02', type: 'line', axisType: 'category', data: dataNoneLinearWithNull},
        {id: '03', type: 'line', axisType: 'value', data: dataNoneLinear},
        {id: '04', type: 'line', axisType: 'value', data: dataNoneLinearWithNull},
        {id: '05', type: 'line', axisType: 'time', data: dataTimeNoneLinear},
        {id: '06', type: 'line', axisType: 'time', data: dataTimeNoneLinearWithNull},
    ];

    function createChartDOMDiv(id) {
        let element = document.getElementById(id);
        if (!element) {
            element = document.createElement('div');
            element.id = id;
            document.body.appendChild(element);
        }
    }

    function getDataZoom(opt) {
        const dataZoom = {
            borderColor: 'blue',
            fillerColor: 'rgba(0, 255, 0, 0.2)',
            dataBackground: {
                lineStyle: {
                    color: 'blue'
                },
                areaStyle: {
                    color: 'rgba(0, 0, 255, 0.6)'
                }
            },
            selectedDataBackground: {
                lineStyle: {
                    color: 'blue'
                },
                areaStyle: {
                    color: 'rgba(0, 0, 255, 0.6)'
                }
            }
        };
        return Object.assign(opt, dataZoom);
    }

    charts.forEach(function ({id, type, axisType, data}) {
        createChartDOMDiv(id);

        require([
            'echarts',
        ], function (echarts) {
            var option;

            option = {
                xAxis: {
                    type: axisType
                },
                yAxis: {
                    type: axisType
                },
                series: [
                    {
                        data: data,
                        type: type
                    }
                ],
                dataZoom: [
                    getDataZoom({
                        xAxisIndex: 0,
                    }),
                    getDataZoom({
                        yAxisIndex: 0,
                    }),
                ]
            };

            testHelper.create(echarts, id, {
                title: [
                    "Test DataZoom on x and y axis",
                    `${type} | ${axisType}`,
                ],
                info: {
                    type: type,
                    xAxisType: axisType,
                    yAxisType: axisType,
                },
                dataTable: {
                    x: data.map(d => d[0]),
                    y: data.map(d => d[1]),
                },
                option: option
            });
        });
    })
</script>
</body>
</html>
Any idea when this will be released to the stable npm channel? Thanks.