[Bug] Considerable difference between Firefox and Chrome displaying plot line chart
Version
5.3.2
Link to Minimal Reproduction
No response
Steps to Reproduce
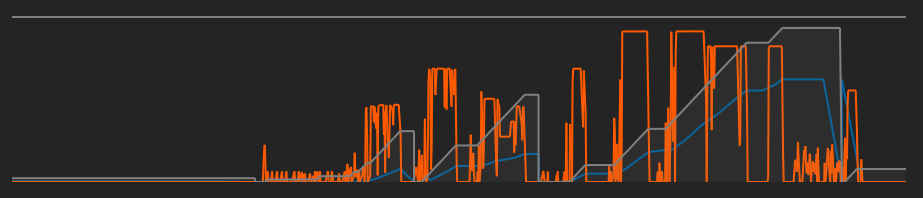
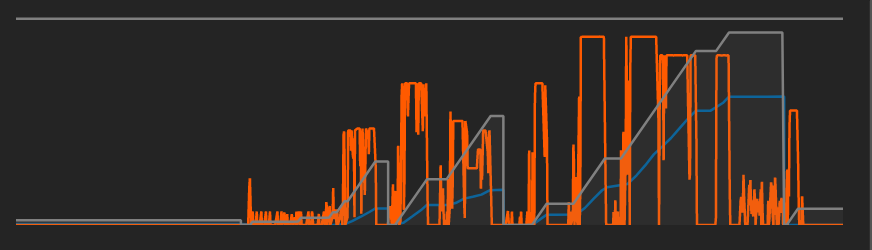
Step 1 : Create an array of elements of type { name: date, value: string }, add two elements with the same date, one of them's value should be 0, Step 2 : Now that our array is created, try to push it into chart series ( when logging the series, I've noticed that the order of the elements pushed into series changed in Firefox) Step 3 : Run the app, and open it in both Firefox and Chrome, a considerable difference will be noticed when displaying the chart
Current Behavior
Expected Behavior
Environment
- OS: Microsoft Windows 10
- Browser: Mozilla Firefox
- Framework: Angular 13
Any additional comments?
No response
I'm sorry to close this issue for it lacks the necessary title. Please provide a descriptive and as concise as possible title to describe your problems or requests and then the maintainers or I will reopen this issue.
Every good bug report or feature request starts with a title. Your issue title is a critical element as it's the first thing maintainers see.
A good issue title makes it easier for maintainers to understand what the issue is, easily locate it, and know what steps they'll need to take to fix it.
Moreover, it's better to include keywords, as this makes it easier to find the issue self and similar issues in searches.
This issue has been automatically marked as stale because it did not have recent activity. It will be closed in 7 days if no further activity occurs. If you wish not to mark it as stale, please leave a comment in this issue.
This issue has been automatically closed because it did not have recent activity. If this remains to be a problem with the latest version of Apache ECharts, please open a new issue and link this to it. Thanks!