[Bug] when use echart.connect to link charts, if one chart's data is outside the zoom range, this chart's axisPointer will be invisible
Version
5.3.2
Link to Minimal Reproduction
https://codepen.io/todwang/pen/RwQgrGB
Steps to Reproduce
var chart1 = echarts.init(document.getElementById("chart1")); var option1 = { title: { text: "chart1" }, tooltip: { trigger: "axis" }, legend: { data: ["今天", "昨天", "上周"] }, xAxis: { data: ["8:00", "10:00", "12:00", "14:00", "16:00", "18:00", "20:00"] }, yAxis: {}, series: [ { name: "上周", type: "line", data: [10, 35, 20, 13, 16, 18, 41] } ] }; var chart2 = echarts.init(document.getElementById("chart2")); var option2 = { title: { text: "chart2" }, tooltip: { trigger: "axis" }, legend: { data: ["今天", "昨天", "上周"] }, xAxis: { data: ["8:00", "10:00", "12:00", "14:00", "16:00", "18:00", "20:00"] }, yAxis: [{}], series: [ { name: "上周", type: "line", data: [10, 35, 20, 13, 12, 18, 41] } ], dataZoom: [ { yAxisIndex: 0, filterMode: "none", startValue: 20, endValue: 30 } ] };
chart1.setOption(option1); chart2.setOption(option2); chart1.group = "group1"; chart2.group = "group1"; echarts.connect("group1");
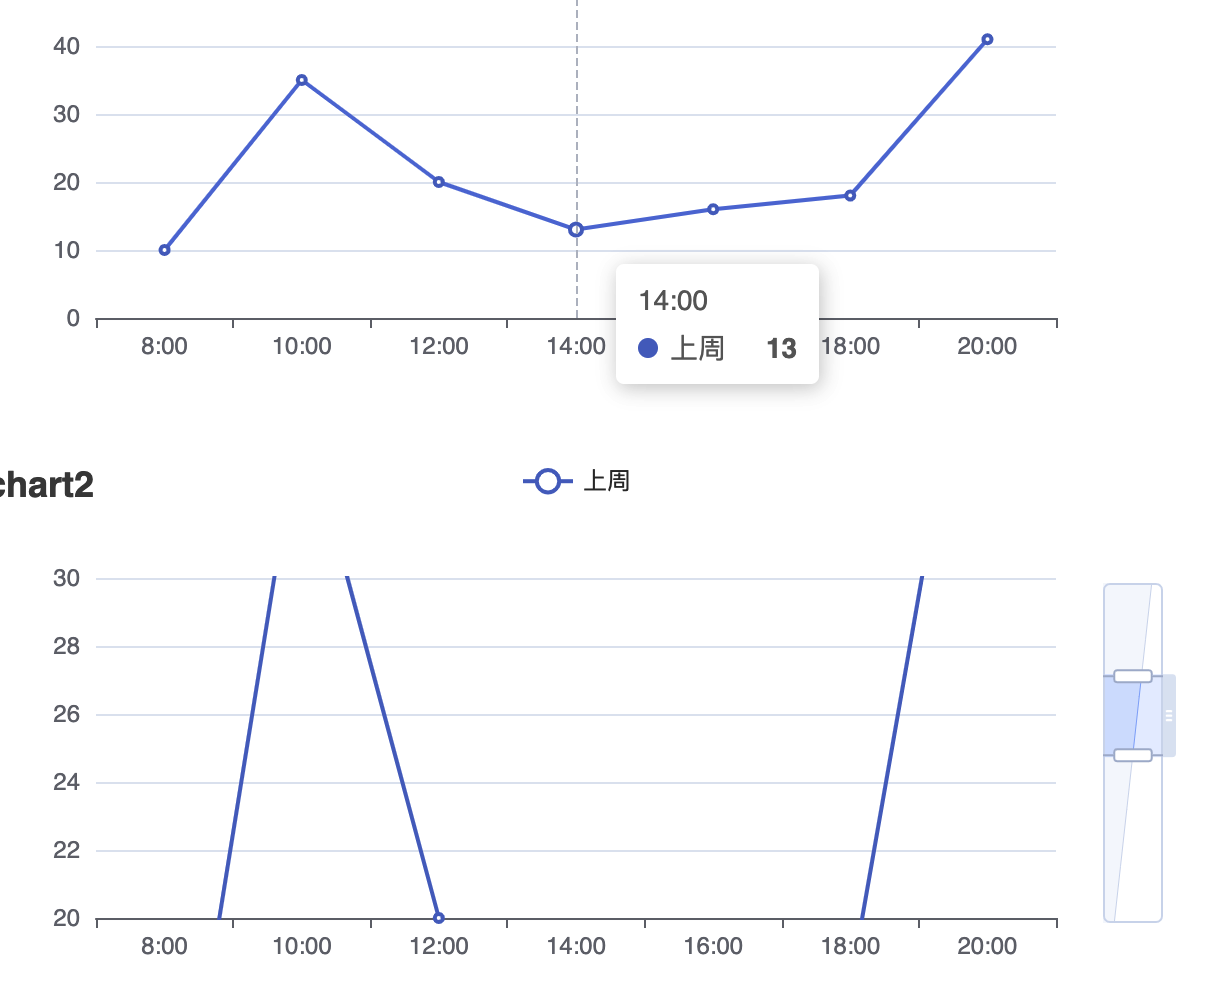
Current Behavior
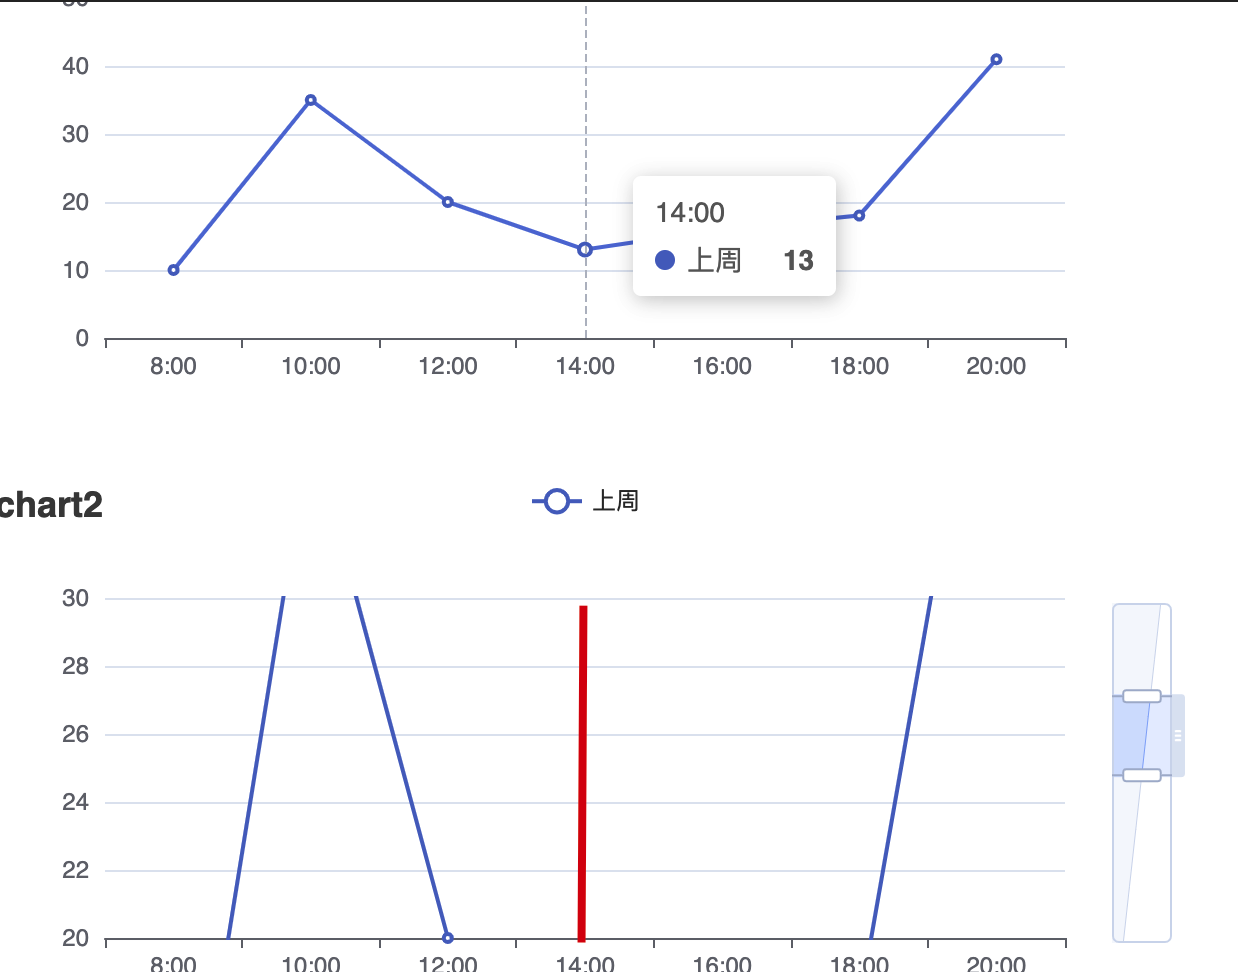
Expected Behavior
Environment
- OS:
- Browser:
- Framework:
Any additional comments?
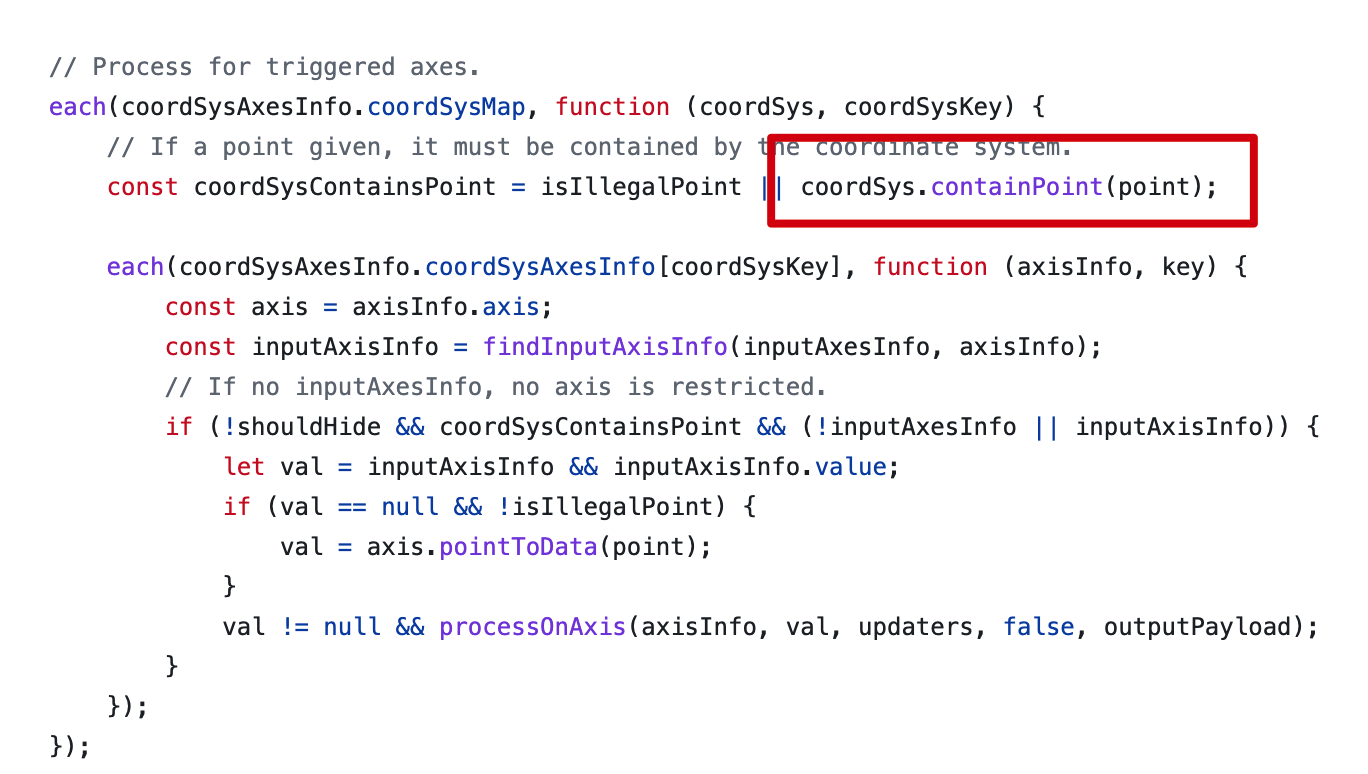
产生这种现象的原因应该是axisTrigger中会判断该点是否在坐标系中
@todwang It seems you are not using English, I've helped translate the content automatically. To make your issue understood by more people and get helped, we'd like to suggest using English next time. 🤗
TRANSLATED
BODY
Version
5.3.2
Link to Minimal Reproduction
https://codepen.io/todwang/pen/RwQgrGB
Steps to Reproduce
var chart1 = echarts.init(document.getElementById("chart1")); var option1 = { title: { text: "chart1" }, tooltip: { trigger: "axis" }, legend: { data: ["today", "yesterday", "last week"] }, xAxis: { data: ["8:00", "10:00", "12:00", "14:00", "16:00", "18:00", "20:00"] }, yAxis: {}, series: [ { name: "last week", type: "line", data: [10, 35, 20, 13, 16, 18, 41] } ] }; var chart2 = echarts.init(document.getElementById("chart2")); var option2 = { title: { text: "chart2" }, tooltip: { trigger: "axis" }, legend: { data: ["today", "yesterday", "last week"] }, xAxis: { data: ["8:00", "10:00", "12:00", "14:00", "16:00", "18:00", "20:00"] }, yAxis: [{}], series: [ { name: "last week", type: "line", data: [10, 35, 20, 13, 12, 18, 41] } ], dataZoom: [ { yAxisIndex: 0, filterMode: "none", startValue: 20, endValue: 30 } ] };
chart1.setOption(option1); chart2.setOption(option2); chart1.group = "group1"; chart2.group = "group1"; echarts.connect("group1");
Current Behavior
Expected Behavior
Environment
- OS:
- Browser:
- Framework:
Any additional comments?
The reason for this phenomenon should be that axisTrigger will determine whether the point is in the coordinate system
I don't think it is a bug. It makes sense to me not to show the pointer if no point is shown at the position. When you put mouse at the zoomed chart, axispointer will be displayed correctly.
I don't think it is a bug. It makes sense to me not to show the pointer if no point is shown at the position. When you put mouse at the zoomed chart, axispointer will be displayed correctly.
系统貌似只会根据seriesIndex=0去判断是否有无数据,如果chart中有两个series,series0数据超出坐标系,series1数据在坐标系中依然会不现实axisPointer, 比如下列情况
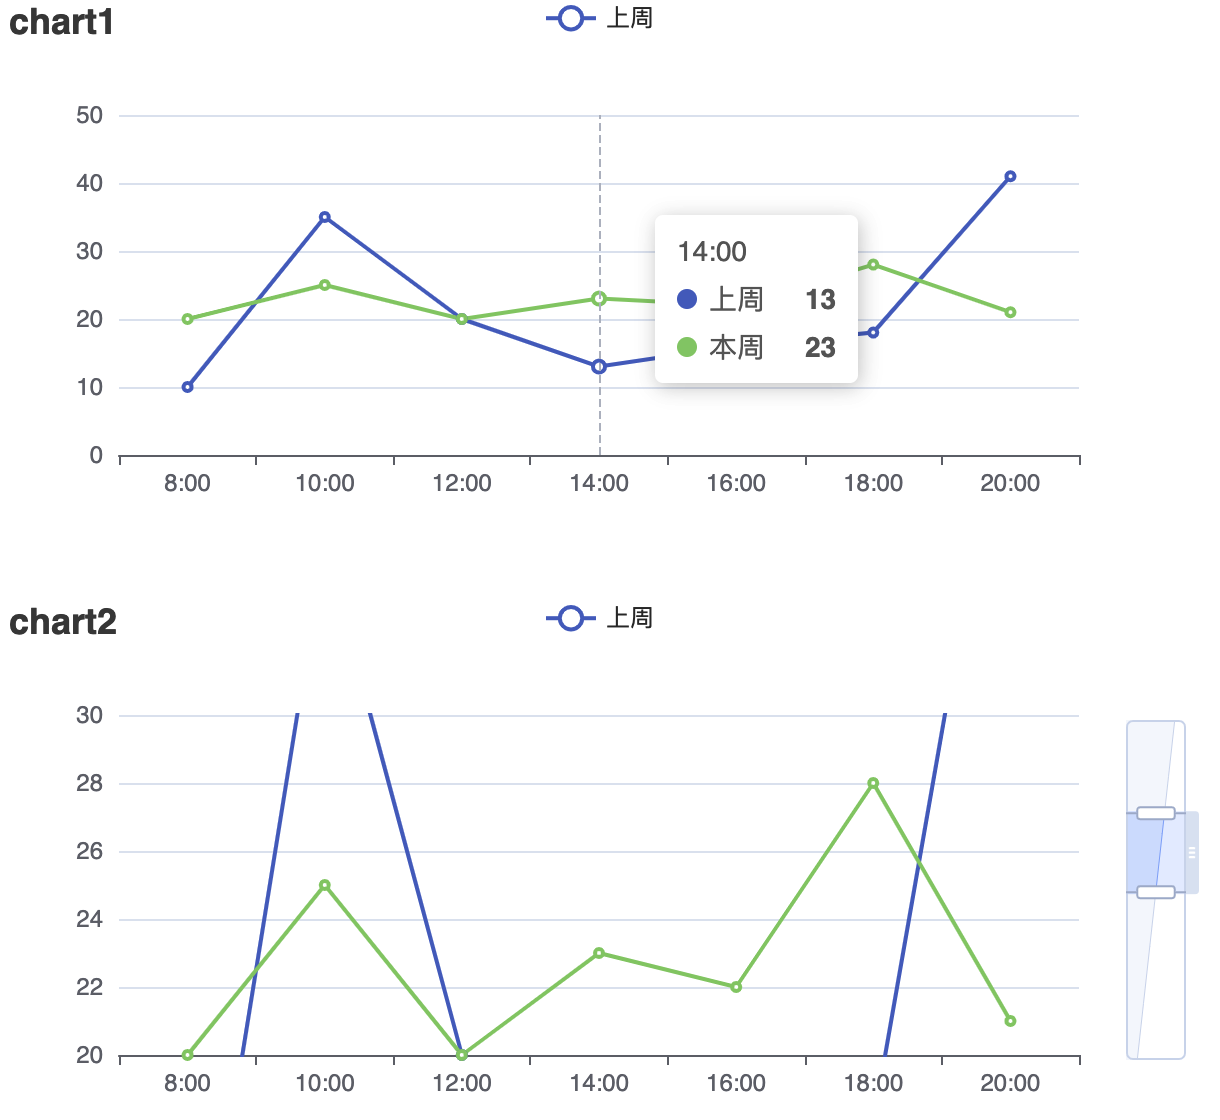 ,
,
两个chart联动时,如果x轴数据在坐标系中,保持x轴有效是不是更合理?
This issue has been automatically marked as stale because it did not have recent activity. It will be closed in 7 days if no further activity occurs. If you wish not to mark it as stale, please leave a comment in this issue.
This issue has been automatically closed because it did not have recent activity. If this remains to be a problem with the latest version of Apache ECharts, please open a new issue and link this to it. Thanks!