echarts
 echarts copied to clipboard
fix: log axis extent display incorrectly
Brief Information
This pull request is in the type of:
- [x] bug fixing
- [ ] new feature
- [ ] others
What does this PR do?
Fix the problem that log axis extent displays incorrectly when user set max/min for it or the data max is too large.
Fixed issues
- fix #16992
- correctly fix #4158
Details
Before: What was the problem?
Problem 1
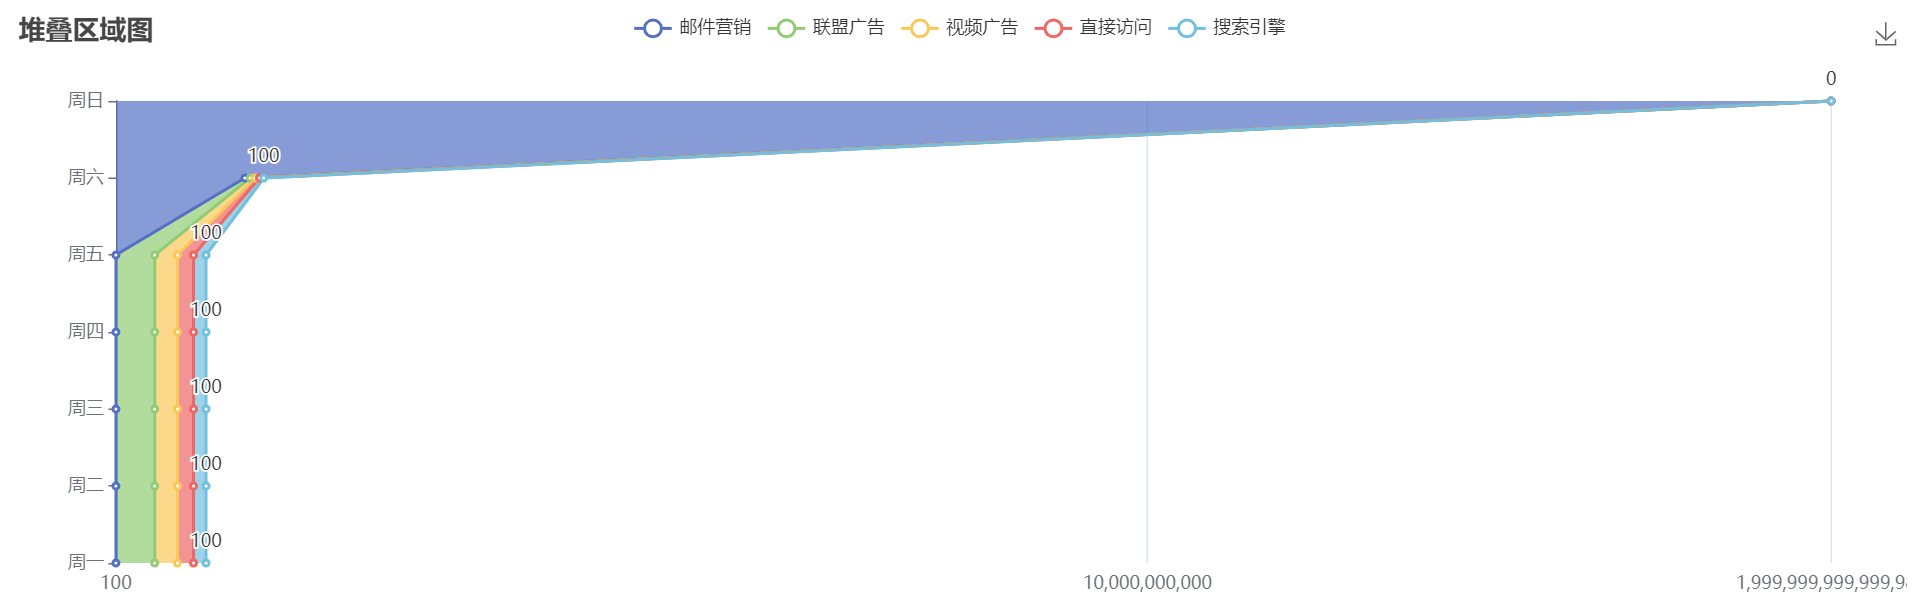
As is stated in #4158. When data is too large and user set max to 'dataMax', the tick label is displayed incorrectly. This is because the data after logarithm cannot keep precision and after exponentiation back, it's different from original data. The former fix is just looking at fixing decimal by recovering the precision, but it cannot fix a very large integer.
Max data = 2000000000000000; max = 'dataMax'
Problem 2
This problem is caused by the former fix of #4158. As is stated in https://github.com/apache/echarts/issues/16992#issuecomment-1129657338, it's fixing the precision of min set by user (0.01) with the precision of real min of data (44), deriving a 0 as min and 0 has nowhere to go on log scale axis.

After: How is it fixed in this PR?
This PR change the way to fix #4158. Instead of fixing the precision of wrong logarithm result, the originalExtent is directly used as the tick label if user sets it as 'dataMax'/'dataMin'. Also a check is added to see if user set a number as min/max and use it directly as head/tail tick label. This way avoid checking precision and also solves the situation where user set a number as min/max.

Misc
- [ ] The API has been changed (apache/echarts-doc#xxx).
- [ ] This PR depends on ZRender changes (ecomfe/zrender#xxx).
Related test cases or examples to use the new APIs
logScale.html
Others
Merging options
- [x] Please squash the commits into a single one when merging.
Other information
Thanks for your contribution! The community will review it ASAP. In the meanwhile, please checkout the coding standard and Wiki about How to make a pull request.