radiusAxis type 'log' is not working for Radial Polar Bar Chart
Version
5.2
Link to Minimal Reproduction
No response
Steps to Reproduce
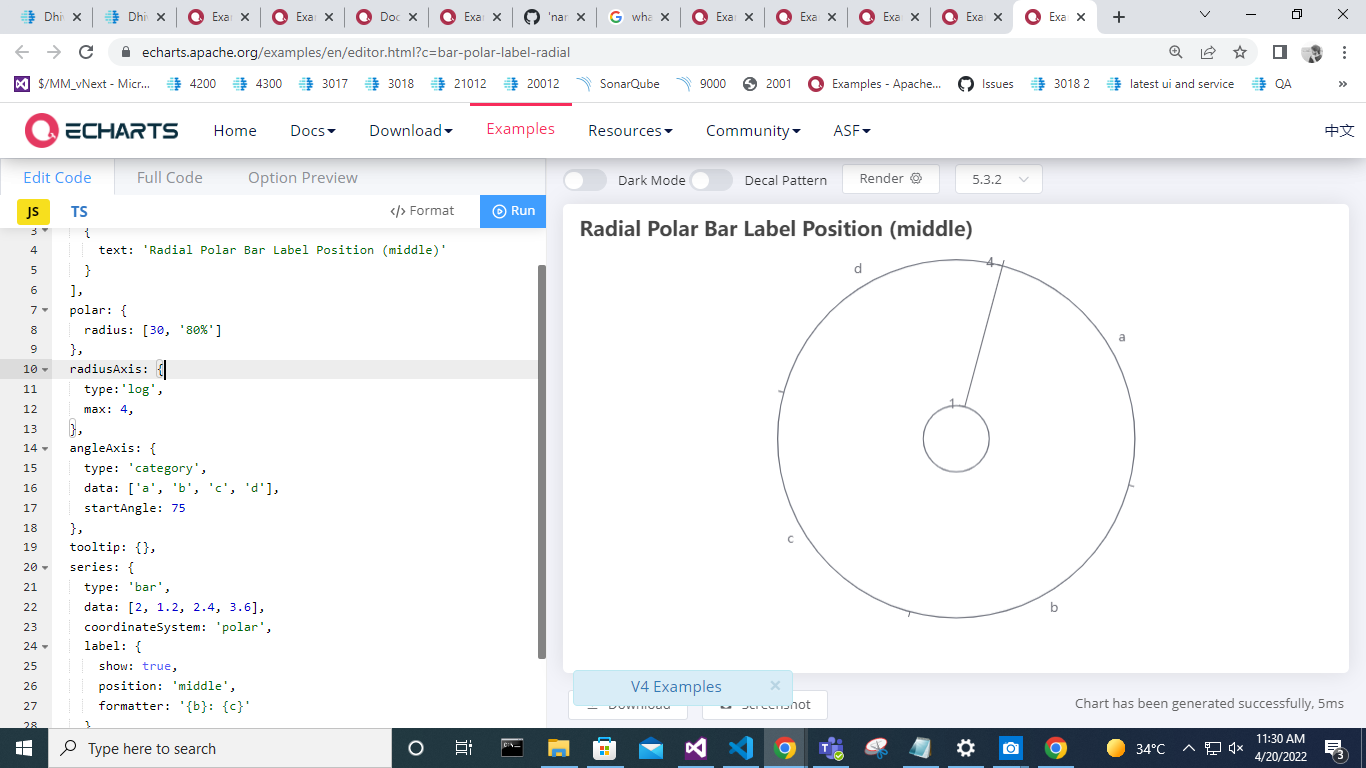
- Plot a Basic Radial Polar Bar Chart or take the sample from Examples section
- add type:'log' for radiusAxis.
Current Behavior
Chart is not getting plotted.
Expected Behavior
Chart should get plotted with radiusAxis with logScale
Environment
- OS:Windows
- Browser:Chrome
Any additional comments?
No response
Hi @Ovilia We use it same like how we use for normal xAxis and yAxis. Are we supporting it now?
I would love to see this function.
I need it to plot signal blocking events from a specific cardinal direction from a radar. Each blocking event is counted and displayed on a 360° axis. Since there can be many events from one direction, but other smaller events are also important I need the logarithmic scaling.
In the current situation, i have to manipulate the data beforehand to get a similar result, but that costs more computing time.
The result should look like this:
upvoting this.
btw @cfrepak how do you achieve a polar diagram with the 360 degrees? are those 360 different categories or have you actually managed to use a numerical axis ?
uff, that was a long time ago ;-) i'll just share my unfinished code so you can see for yourself:
// function blockZones(txm, azi, len) {
function blockZones(data) {
  console.log("loading block zones");

  // const blockZonesDiv = document.createElement("div");
  // blockZonesDiv.style = "width: 90%; height: 500px"
  // document.getElementById("content").appendChild(blockZonesDiv);

  // var bzChart = echarts.init(blockZonesDiv, null, {
  var bzChart = echarts.init(document.getElementById("blockZones"), null, {
    renderer: "canvas",
    useDirtyRect: false
  });

  const block = new Array(360).fill(0);

  // for (i = 0; i < len; i++) {
  //   if (txm[i] == 1) {
  //     block[azi[i]]++;
  //   }
  // }
  // // because logarithmic scale is not working: see radiusAxis
  // for (i = 0; i <= 360; i++) {
  //   if (block[i] >= 1) {
  //     block[i] = Math.log10(block[i]);
  //   }
  // }


  data.map((d) => {
    if (d.txm == 1) {
      block[d.azi]++;
    }
  });

  block.map((b, i) => {
    if (b >= 1) {
      block[i] = Math.log10(b);
    }
  });

  var option = {
    angleAxis: {
      type: "category",
      // not working with category:
      // data: ["0", "22.5", "45", "67.5", "90", "112.5", "135", "157.5", "180", "202.5", "225", "247.5", "270", "292.5", "315", "337.5"],
      // interval: 22.5,
      // splitnumber: 16,
      min: 0,
      max: 359,
    },
    radiusAxis: {
      // logarithmic scale not working: https://github.com/apache/echarts/issues/16919
      // type: "log",
      // logBase: 10,
      min: 0,
      max: "dataMax",
      axisLine: { show: false, },
      axisTick: { show: false, },
      axisLabel: { show: false, },
    },
    polar: {
    },
    tooltip: {
      formatter: (params) => {
        return params.name + "°: " + Math.round(Math.pow(10, params.data)) + " TX Off events";
      }
    },
    series: {
      type: "bar",
      data: block,
      coordinateSystem: "polar",
      itemStyle: {
        color: "#bd565d",
      },
    },
  };
  bzChart.setOption(option, true);
}