[Bug] do not combine dates on the chart line, when setting "stack" and type: 'time'
Version
5.3.1
Link to Minimal Reproduction
https://echarts.apache.org/examples/en/editor.html
Steps to Reproduce
option = {
  legend: {},
  xAxis: {
    type: 'time', min: '2018-08-09 10:00:00',
    name: 'Date',
  },
  yAxis: {
    type: 'category',
  },
  dataset: [
    {
      id: 'q1',
      source: [
        ['nm1', 'er1', 'er2'],
        ['bar', '2018-08-10 10:00:00', '2018-08-11 20:00:00'],
      ]
    }
  ],

  series: [
      { type: 'bar',  datasetId: 'q1', stack: 'bar1', name: 'start',
          encode: {
            x: 'er1',
            y: 'nm1'
          },
        itemStyle: {
          color: 'red'
        },
      },
      { type: 'bar', datasetId: 'q1',  stack: 'bar1', name: 'end',
          encode: {
            x: 'er2',
            y: 'nm1'
          },
        itemStyle: {
          color: 'blue'
        }
      }
  ]

};
Current Behavior
do not combine dates on the graph line when setting "stack".
If you specify the data as a date and combine it through a stack, then the graph is superimposed on each other. The stack does not work for type: 'time', but if you specify type: 'value ', then everything works.
Expected Behavior
So that the schedule does not overlap with each other
Environment
- OS:windows 10
- Browser: Chrome 98
- Framework: -
Any additional comments?
No response
Hi, for now time and category type axis does not seem to support stack. Only value and log axis supports stack. @plainheart @pissang Should we add a notice about the scope of stack usage to documentation?
I am experiencing this same issue with x-axis being a category; however not sure if related, I am using multiple series on Y-axis, and if I disable certain one's, it will show the data of the one's hidden from stacking, and if all enabled, it will stack incorrectly, and not appear in the tooltip on hover.
with all enabled:
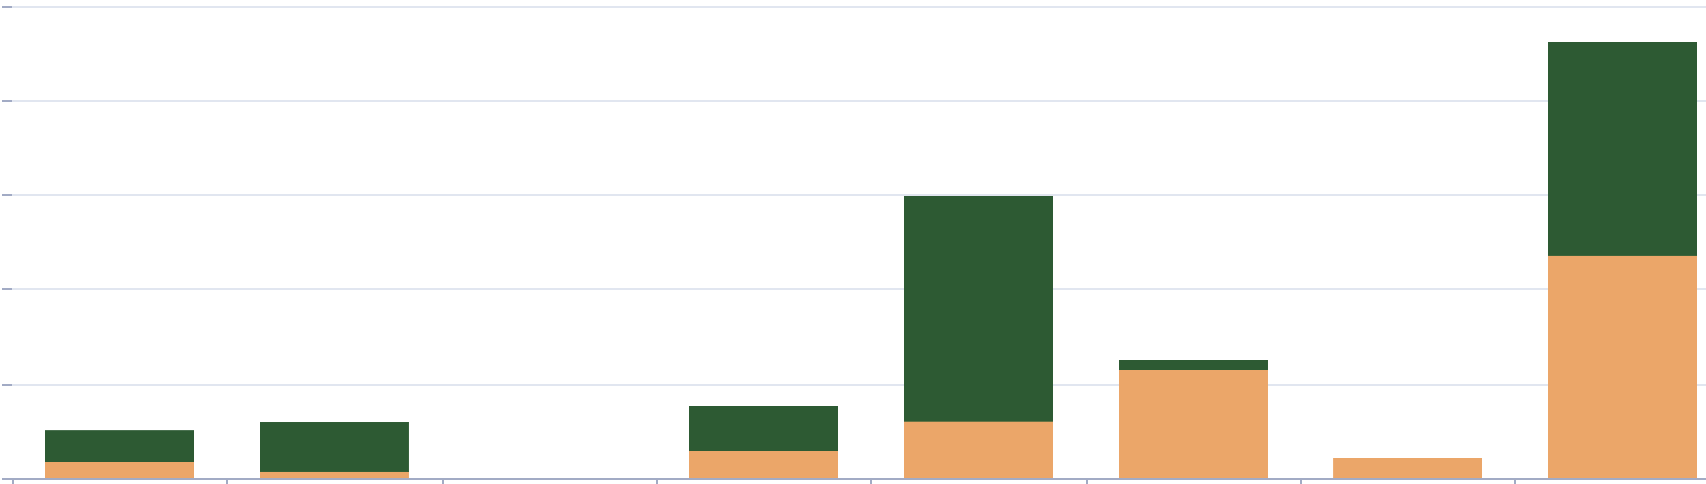
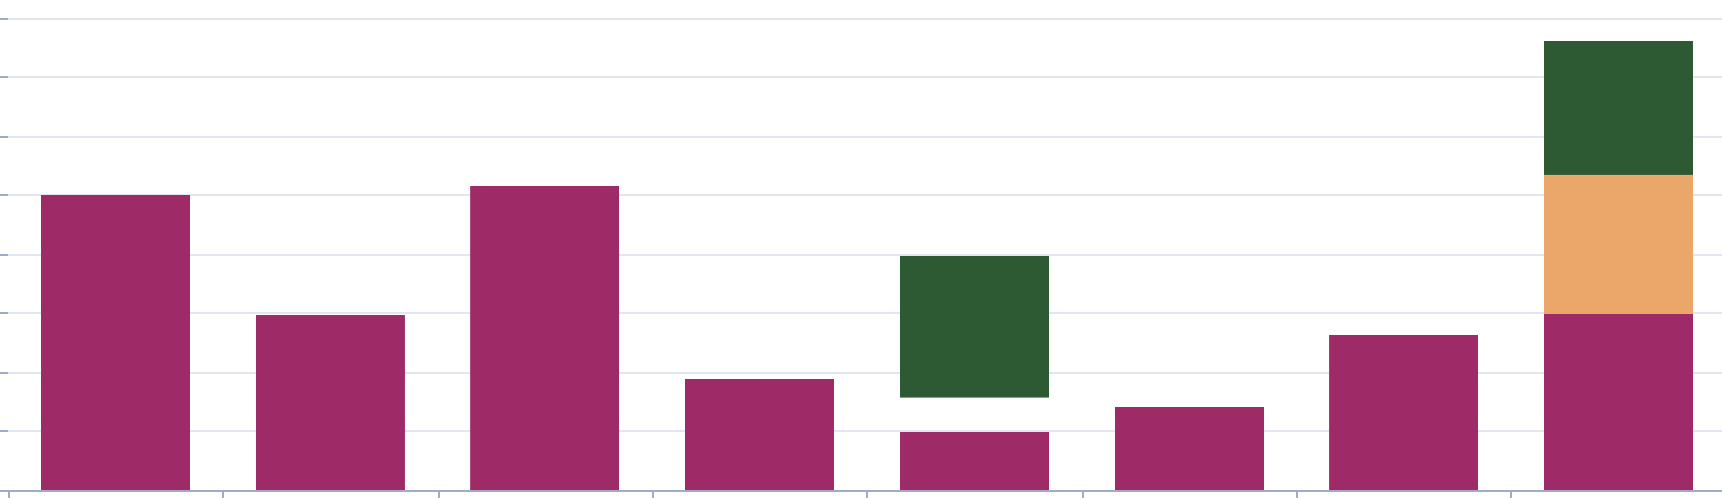 vs if I disable the pink
@jiawulin001 Here is the code showing the data:
                        .map((dataPoint) => ({
                            // eslint-disable-line prettier/prettier
                            ...dataPoint, // the format we use
                            // the format echarts axis uses
                            value:
                                layout === 'horizontal'
                                    ? [dataPoint[xDataKey], dataPoint[serum.name], dataPoint[zDataKey]]
                                    : [dataPoint[serum.name], dataPoint[yDataKey], dataPoint[zDataKey]],
                        }))
                        .filter((point) => point.value[0] !== undefined && point.value[1] !== undefined),
When console logging data, it shows that the 5th column has the values:
{
    "veqwGEb4DiZugpQJG9TiQ": 59.16498827262963,
    "UdEZvxRplMLIp2u0UDMCf": 18.090609023464722,
    "sqeJySXDsyyrErIfSv6Ld": null,
    "ik4ue89ET8QfseEE1HtGB": null,
    "aVMOxXnch1ftsMvwKR89q": 71.40060481507766,
    "j38A@F8N8mpreQmlRiKv8": "SHG"
}
and as seen in the first picture, it is only showing the 59.16 and 71.4 values. Then if you remove the 59.16 value in legend, it shows the 18.09 value.
Yet weirdly enough the last column shows the data appropriately:
{
    "veqwGEb4DiZugpQJG9TiQ": 119.79032873964,
    "UdEZvxRplMLIp2u0UDMCf": 70.82665533598106,
    "sqeJySXDsyyrErIfSv6Ld": null,
    "ik4ue89ET8QfseEE1HtGB": null,
    "aVMOxXnch1ftsMvwKR89q": 67.60575370017129,
    "j38A@F8N8mpreQmlRiKv8": "WLD"
}
Does this help illustrate it? Or is there other portions of the code that could help? Thank you!
I think we should.
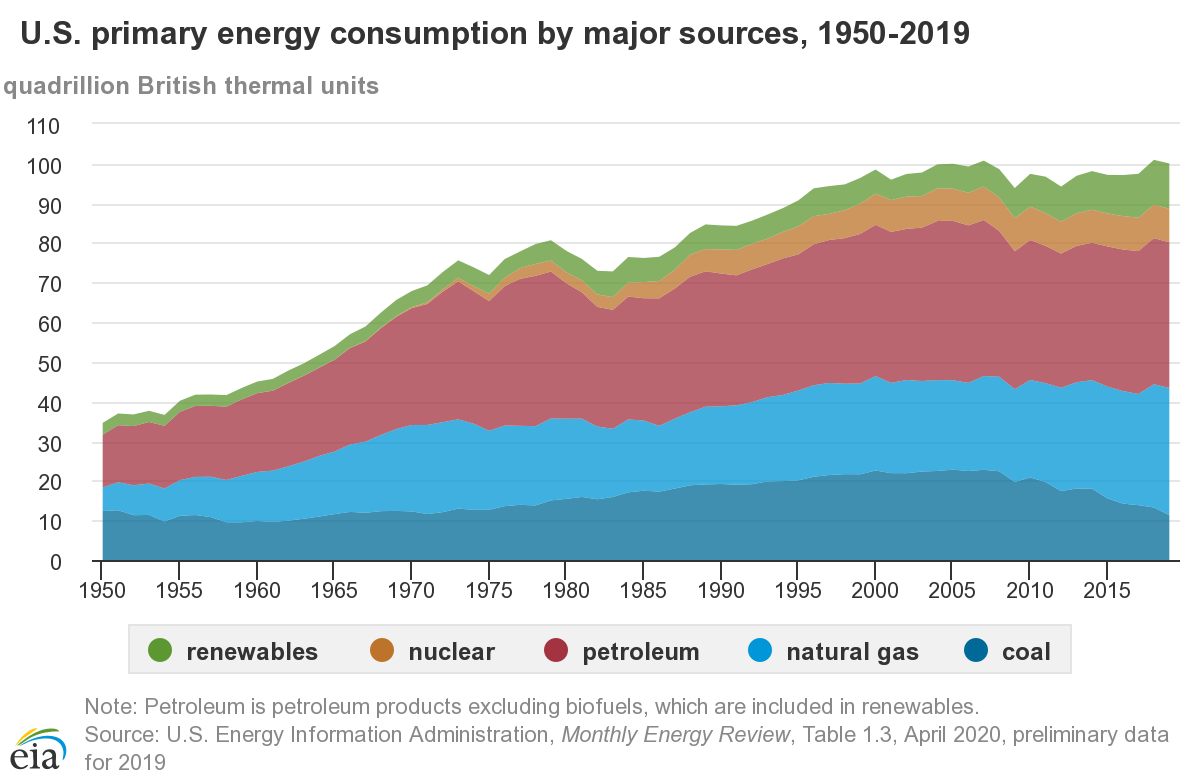
stackis meaningless on thetimeandcategoryaxis
Hi, why is it meaningless? For such kind of graph (energy consumption by source), to allow to zoom into year/month/day/hour.
@jiawulin001 Here is a simple example that I believe shows the "gap" issue mentioned by @ozdv -- I believe the problem is something to do with what happens when some series do not have data for all x-axis values. In some cases, this also causes an overlap in the series bars. By changing the version of echarts used, you can see this was not a problem in 5.2.2, but is a problem in every version from 5.3.0 https://echarts.apache.org/examples/en/editor.html?c=bar-simple&code=PYBwLglsB2AEC8sDeAoWsAeBBDEDOAXMmurGAJ4gCmRA5JALZW0A0JAvm-uTvkaqTKUasWgDcAhgBsArsw5dYAEwlgJeKmCIBtEuiTKITaHigmdtCEtajgAIw0AnMVSUB9VTfHS5tALossHjAMo4AxiK6gvqwVnQAjDb2Ti7uqkTxgZKyIvGw7HqwfvmKMUpGVCZmhLDaltaBtMlUzq4eYF7ZvgFBIeGRhTFxogBMSQ4tqe1EI1k-IiP5hcUF6AEkThBUNVGkAtEU1HR2Eo6sg8qq6poAktBKVBhEAAylpMMARPEfb-h4amEANZED5gYBqKQ_C6VMLAB78C7oJ62CatNIdX6kch0LryaJLQScQr7QSHES0E5nTEqNQaMB3B7IzIXT4jKH4_4SIEgsEQ9nRGFwkQk6LIpqoqaeTHcHHzWgXVakIlrFDsADcQA&version=5.3.0
5.2.2
5.3.0
@jiawulin001 The gap and overlap issue is even happening when using type: 'value' for the xAxis:
5.2.2
5.3.0
https://echarts.apache.org/examples/en/editor.html?code=PYBwLglsB2AEC8sDeAoWsAeBBDEDOAXMmurGAJ4gCmRA5AG4CGANgK5W0kC-ANCeTnxFUpMpRqwGLdp3S8SAE0ZhGeKmCIBtEuhGjYeYKwBOAYwnb9pJLGiMAthNoAhWj0wA1aRICM78l5sEgBMsPJWurYOTq7uGIHsRADM_gkhYXwRyFGOdLGe3kQArKmFsKFcOqQAupn6ChCO0HhQzVpVorR2jm4dpLQB3r1ZtPFDfdVV4dZ9hibm7Vk23U5YbgVBRH6wg5vlGX2RK3RrcWlEwaV7FXVWy9En62N7KTvn-9N3OatP7wAsV0SH1u-nuuUkpw2QJKbzKFQmIPQDSaLRghFglgiXWiwyxuxkiP6zxkEymJFqJDUxggVHRmN0fSo9hAAAtVEJiFkAGbAUysdG0Kk0vCyfSfUgQBR5XGiY6SWJ9JQqNRgACS0AUVAwRAADIS8CpTABrOgGxjGmWkCjUOgAI0Yxkt6Co0FMwE1wkOmDoxI4hPQ5Do-I4fXF6DdzGAxjoAGIuTqdQAOUVyEF6URM1ns9Hp_Q8vkCoW0lOkMOwSWPQly2inRXKVTqdWa7WwPyzQ0myRmi2E61Oe2Owkut0ezkRFujNJO0iByTBkupvoRqOxhNc5Nk9AU9BgYDAZiQECe0Ru6BciDQCRgYzsEF4FnAADuRGvt6qjFweAACsAL2AqNGY6iH2dDMBefp9MwjC2lQzDCJUogIQc6DMFQADmLpSmOABEaioaY_4KNhx6kNhzjEWQN5UCC2FYBRr5UNwKCVFwADcQA