echarts

echarts copied to clipboard
[Feature] `yAxis.max/yAxis.min` of DataShadow(mini chart) in `dataZoom.slider`
What problem does this feature solve?
would be better when yAxis has limit
What does the proposed API look like?
dataZoom: [{
   showDataShadow: false
   dataShadow: {
      yAxis: {
         min: 10,
         max: 100
      }
   }
}]
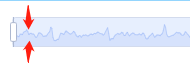
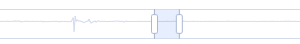
Without limitation, the line chart in the slider will easily look like a straight line (when a few points are too big or too small)
This issue has been automatically marked as stale because it did not have recent activity. It will be closed in 7 days if no further activity occurs. If you wish not to mark it as stale, please leave a comment in this issue.
It seems to me that by setting the range of y limits, makes it confusing to the big picture.