Support for Dendrogram Diagram
What problem does this feature solve?
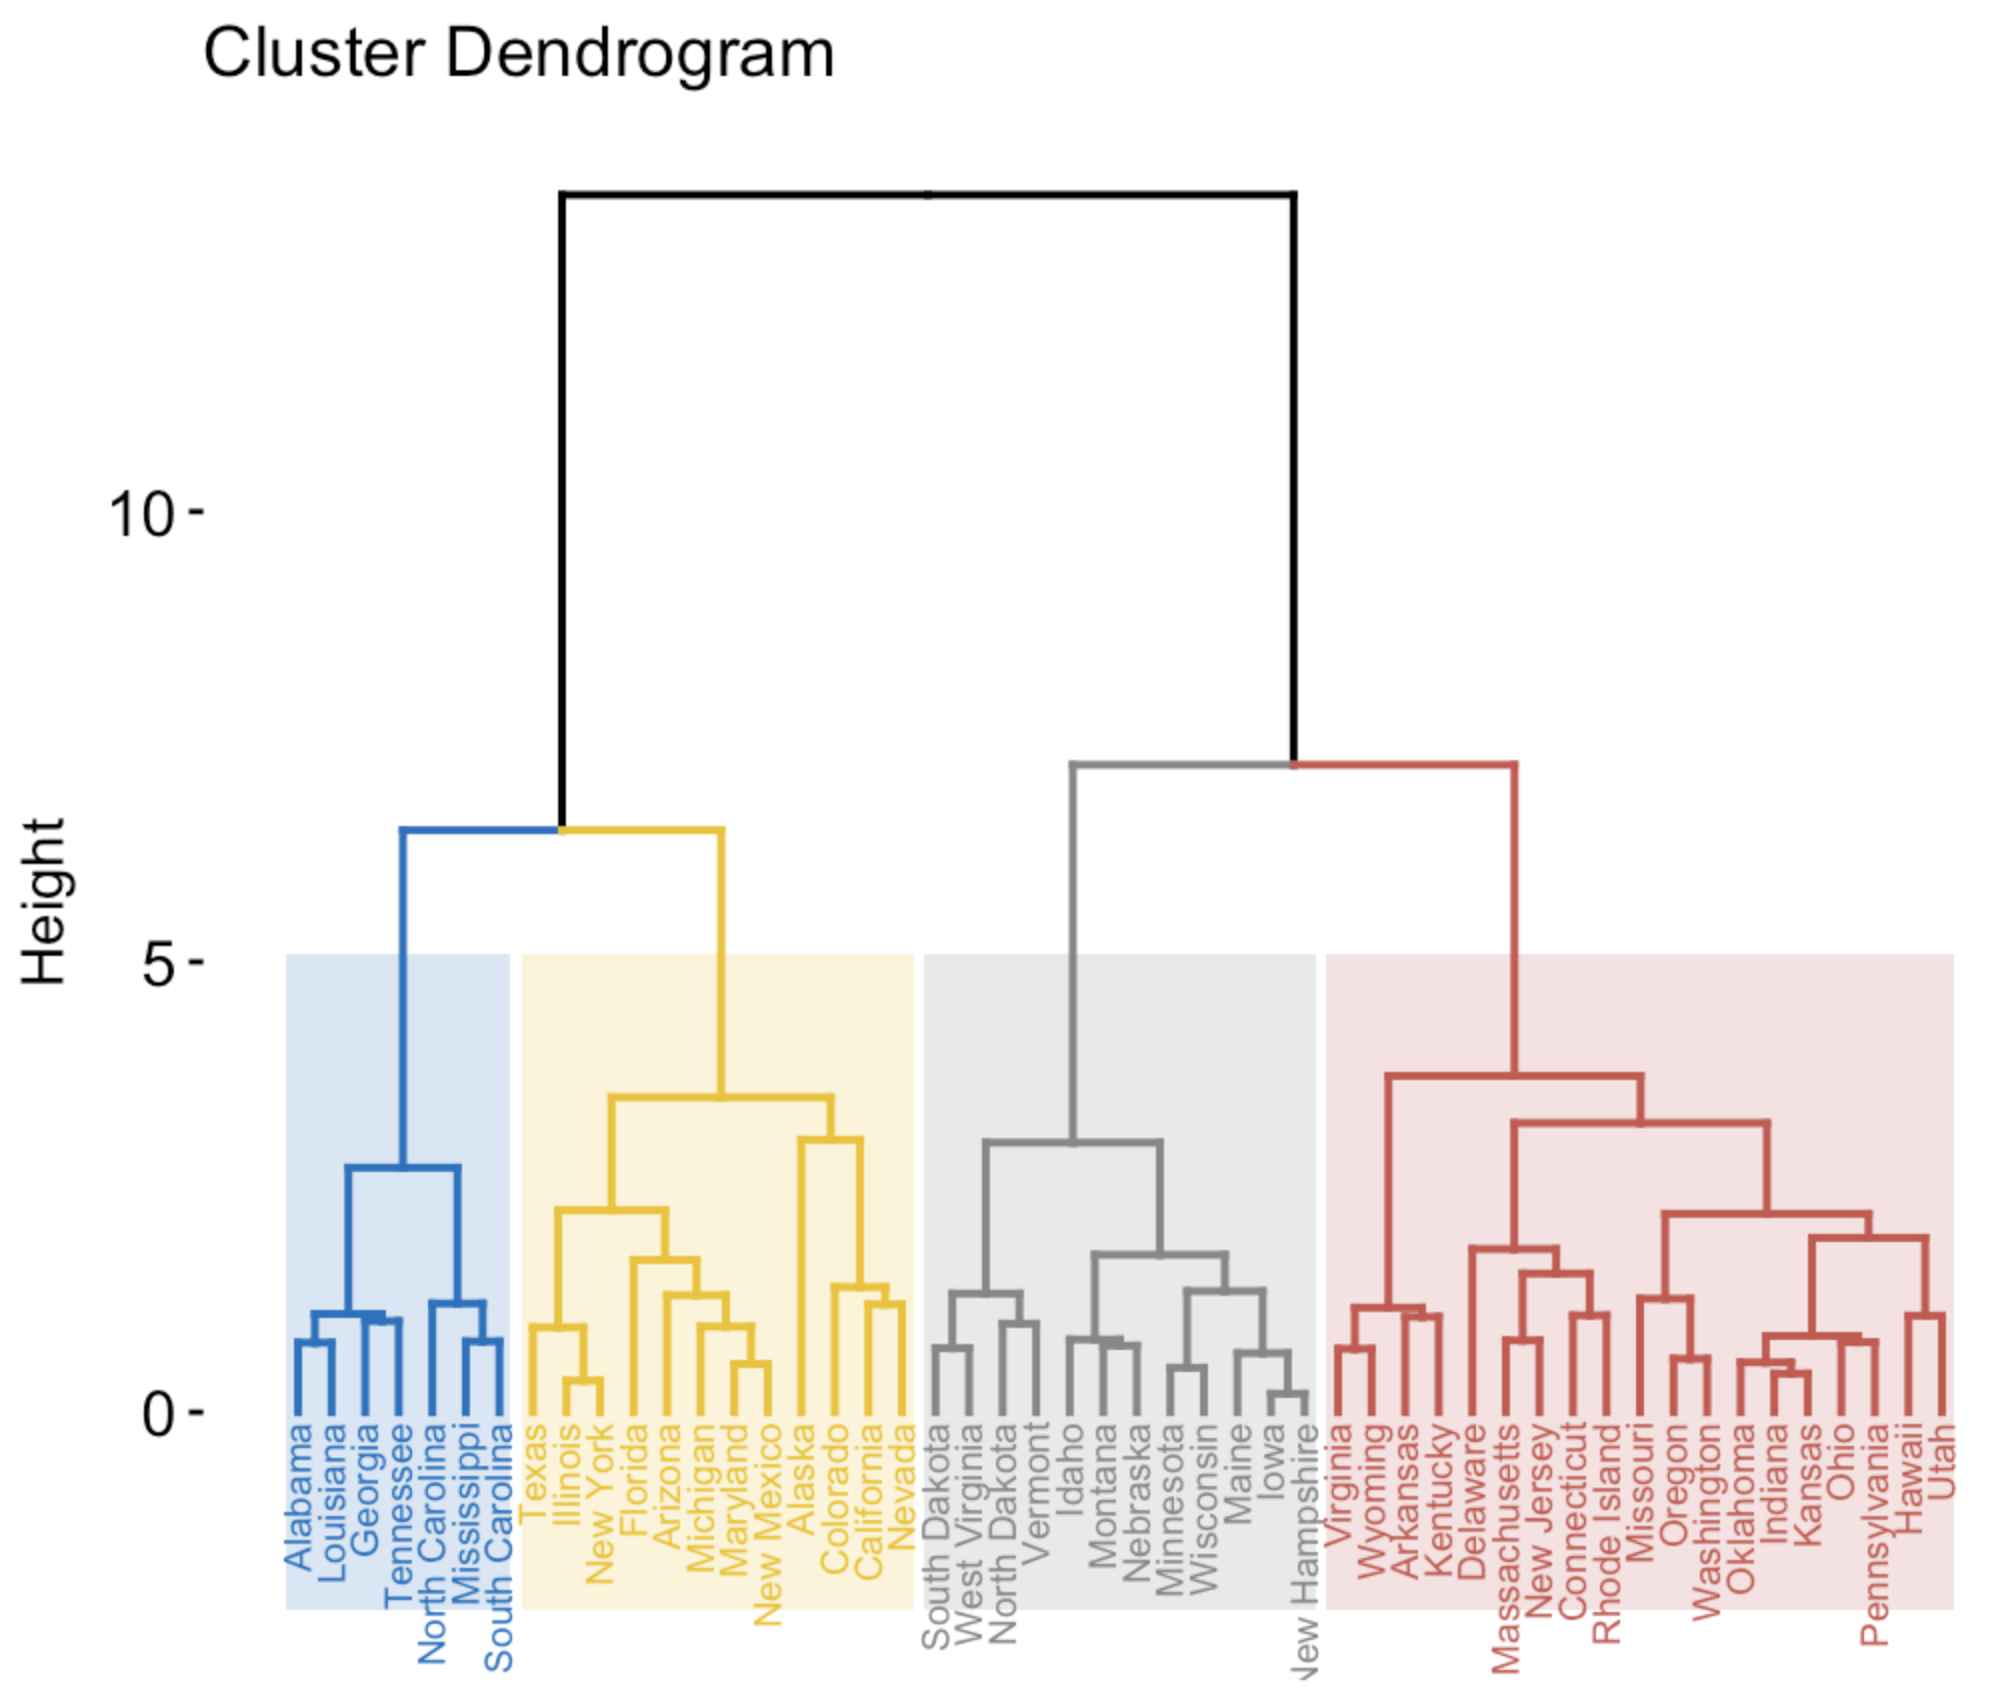
A dendrogram is a diagram that shows the hierarchical relationship between objects. It is most commonly created as an output from hierarchical clustering. The main use of a dendrogram is to work out the best way to allocate objects to clusters.
In our organization we have many use cases where we need to cluster objects/data into hierarchical diagram. Which I am not able find a way to achieve using existing charts in ECharts.
Please let us know in case we can create/extend Dendrograms by customizing ECharts.
What does the proposed API look like?
A special chart type for 'dendrograms' type: 'dendrogram',
Hi! We've received your issue and please be patient to get responded. 🎉 The average response time is expected to be within one day for weekdays.
In the meanwhile, please make sure that you have posted enough image to demo your request. You may also check out the API and chart option to get the answer.
If you don't get helped for a long time (over a week) or have an urgent question to ask, you may also send an email to [email protected]. Please attach the issue link if it's a technical questions.
If you are interested in the project, you may also subscribe our mail list.
Have a nice day! 🍵
Just curious, can the Tree achieve the same thing, or what's missing?
https://echarts.apache.org/examples/en/editor.html?c=tree-polyline
Our team is now exploring using Tree to do Dendrogram + Scatter Plot like so:
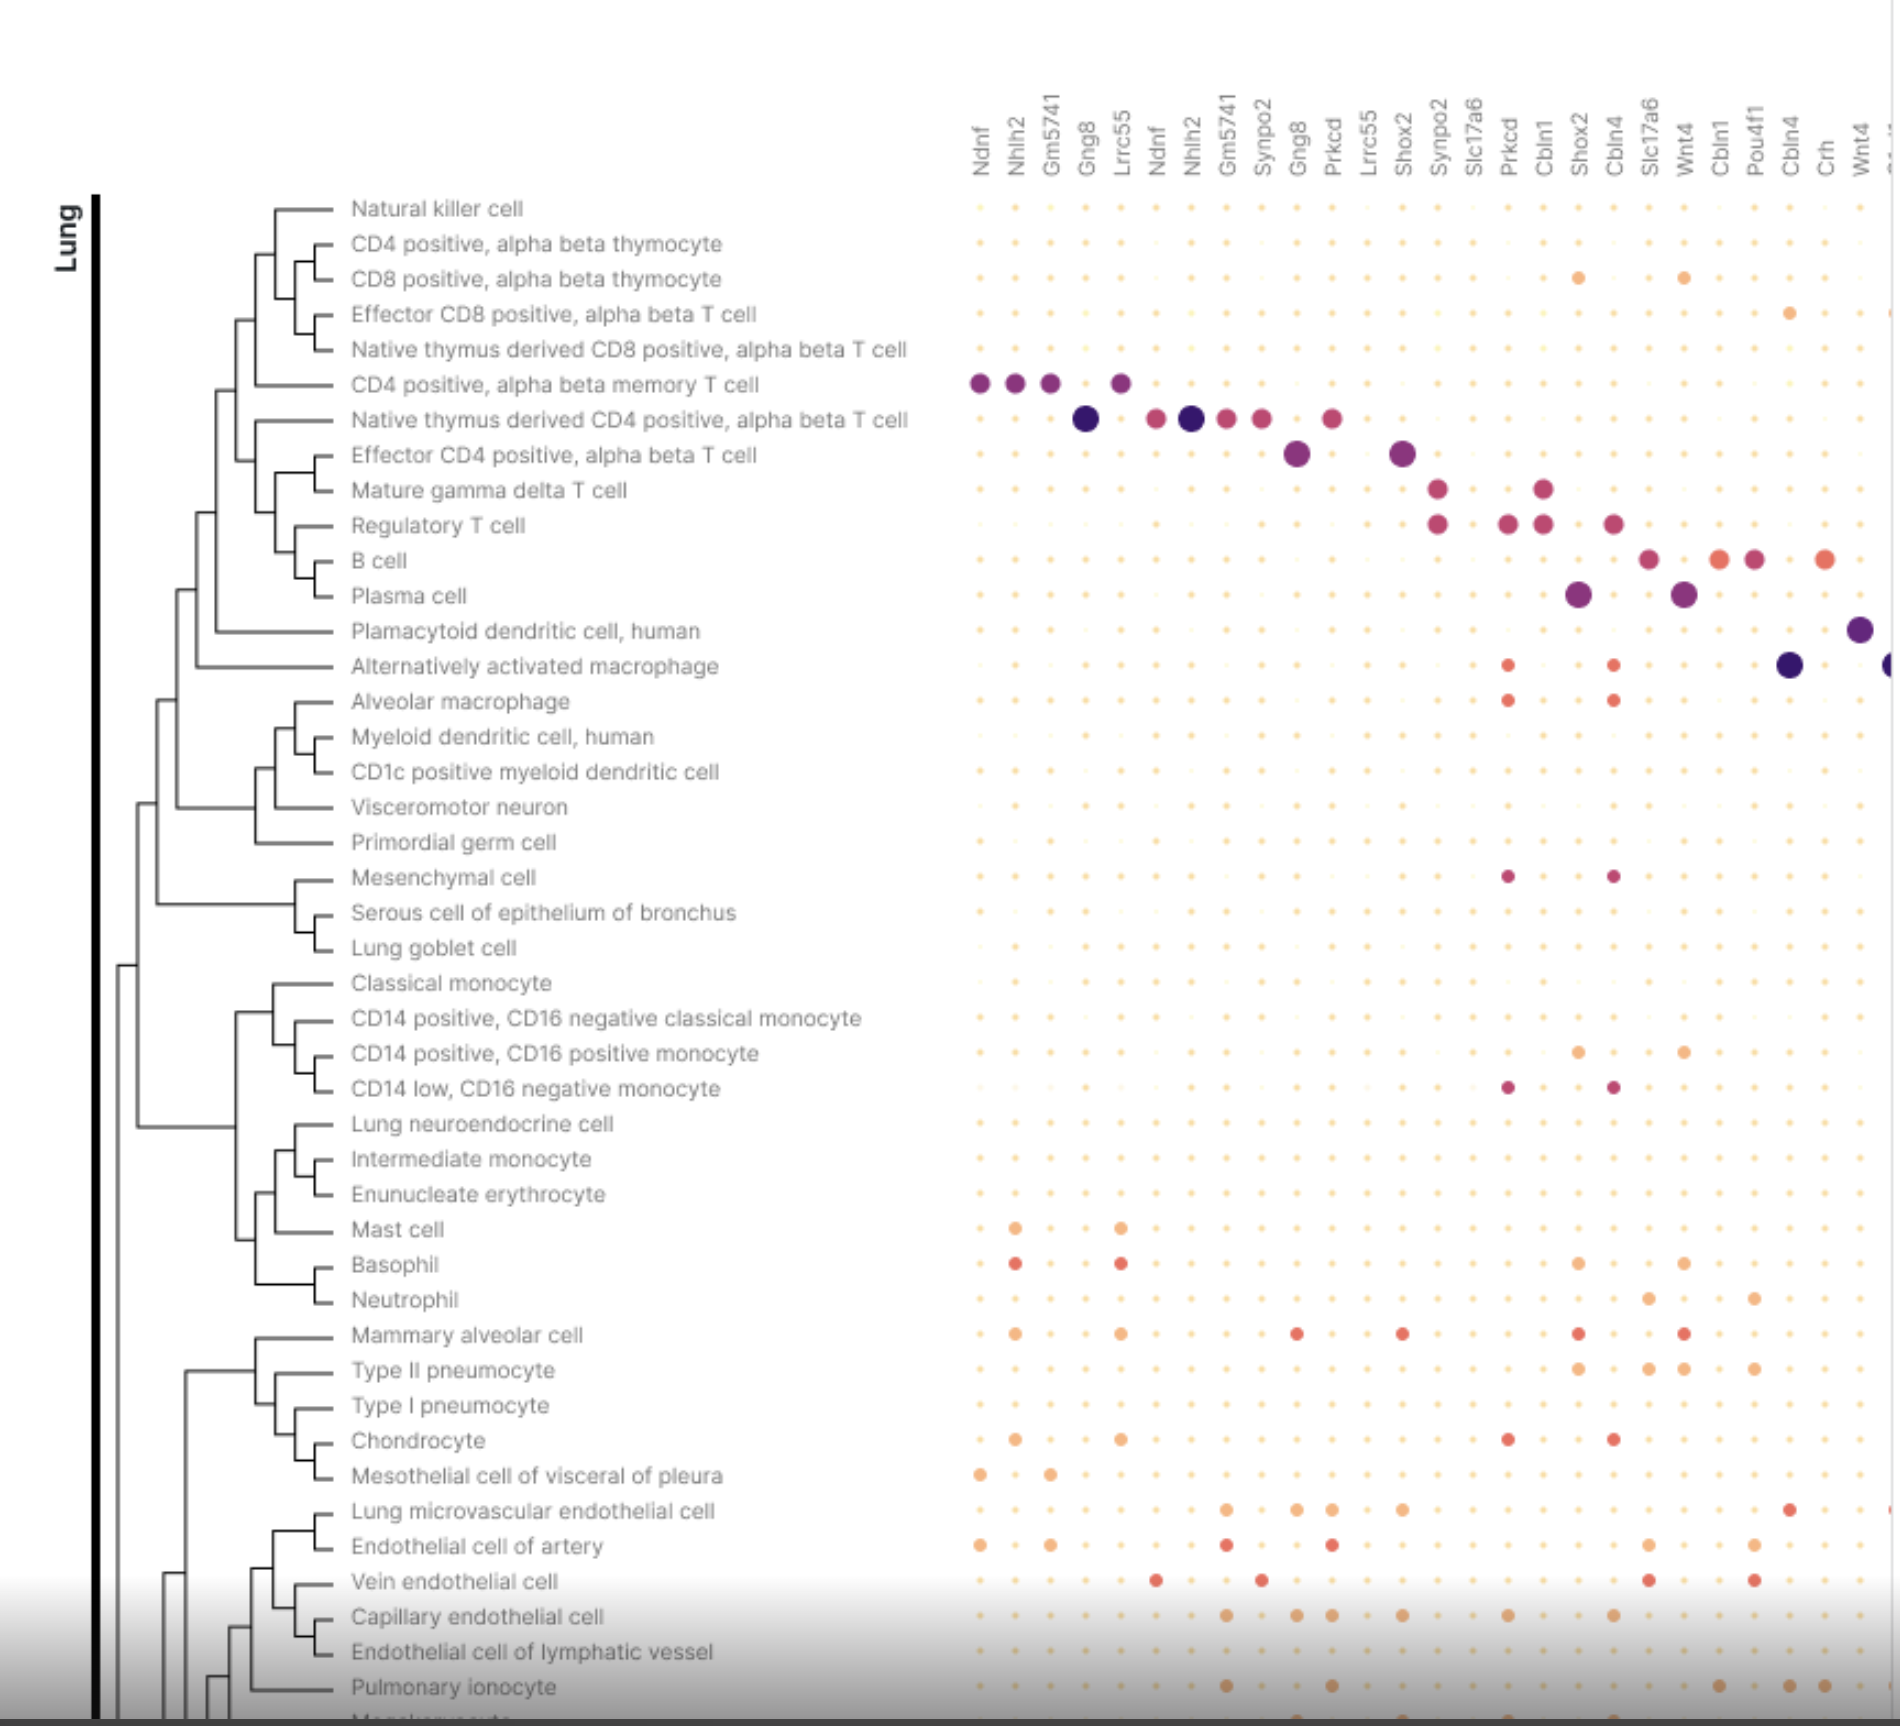
But not sure if I could align the dendrogram with the Scatter Plot label/dots properly 🤔
This, in combination with a heatmap would enable echarts to support clustered heatmaps that are common in the biological sciences, for example: https://seaborn.pydata.org/generated/seaborn.clustermap.html
I'm exploring whether the tree plot type can be used for this but as pointed out above, good alignment is a concern.
Hi! Does anyone have any updates on the matter? I'd like to plot a dendrogram as well.
Thanks!