3D scatter plot legend does not pick the right colors from the data points
Version
4.9.0
Reproduction link
https://jsfiddle.net/ramgorur/zmdhpcwL/latest/
Steps to reproduce
Please go to the JSFiddle link and run the code. No setup necessary.
What is expected?
The legend buttons should pick the correct colors from the data point.
What is actually happening?
The legend does not pick the colors from the data and assigns arbitrary colors on its own.
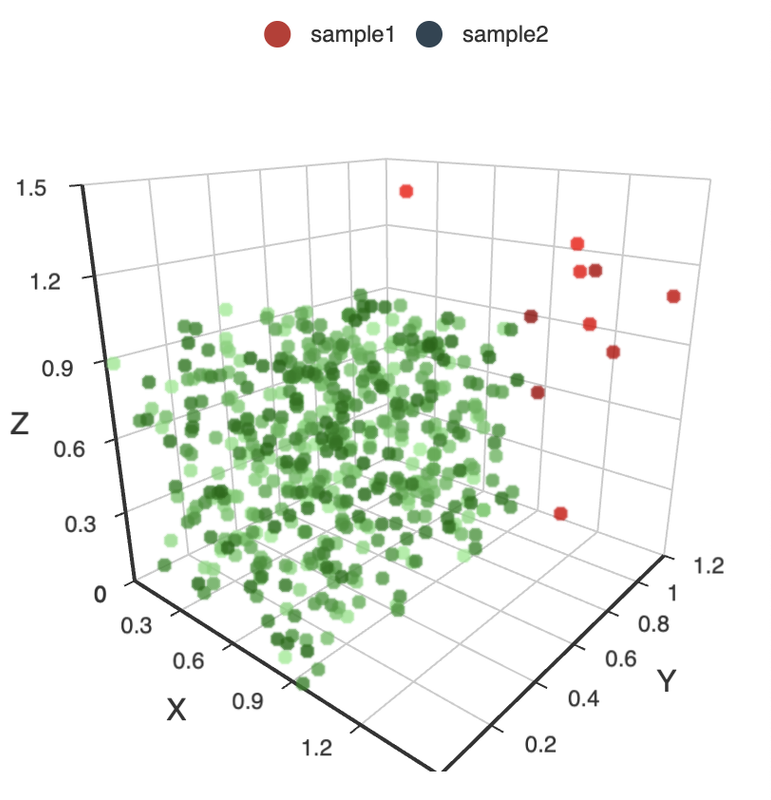
For example, in the plot below, the sample1 legend should have a gradient of green and the sample2 should have red. But they are not --
Not sure if it's a bug, may be I'm not doing it in a correct way.
Hi! We've received your issue and please be patient to get responded. 🎉 The average response time is expected to be within one day for weekdays.
In the meanwhile, please make sure that you have posted enough image to demo your request. You may also check out the API and chart option to get the answer.
If you don't get helped for a long time (over a week) or have an urgent question to ask, you may also send an email to [email protected]. Please attach the issue link if it's a technical questions.
If you are interested in the project, you may also subscribe our mail list.
Have a nice day! 🍵
This issue has been automatically marked as stale because it did not have recent activity. It will be closed in 7 days if no further activity occurs. If you wish not to mark it as stale, please leave a comment in this issue.
This issue has been automatically closed because it did not have recent activity. If this remains to be a problem with the latest version of Apache ECharts, please open a new issue and link this to it. Thanks!
I believe this is still an issue in current versions. When trying to assign a color to each point of the 3d scatterplot the values get shuffled somehow.
I'm having the same issue on a bar3d chart. The initial chart is fine, but after switching variables some bars that have similar height have totally different colors. They get the proper color after a mouse-over.
I built my visualization after this example: https://echarts.apache.org/examples/en/editor.html?c=bar3d-dataset&gl=1