3D scatter plot: visualMap doesn't take colors from series:itemStyle
Version
4.9.0
Reproduction link
https://jsfiddle.net/ramgorur/gxf6La29/
Steps to reproduce
Just go to the JSFiddle and run the code. No setup necessary.
What is expected?
Was expecting the visualMap to get the color: assigned in the itemStyle.
What is actually happening?
It takes the color but the order of the points get shuffled in a strange way.
For example, without visualMap I have this plot:
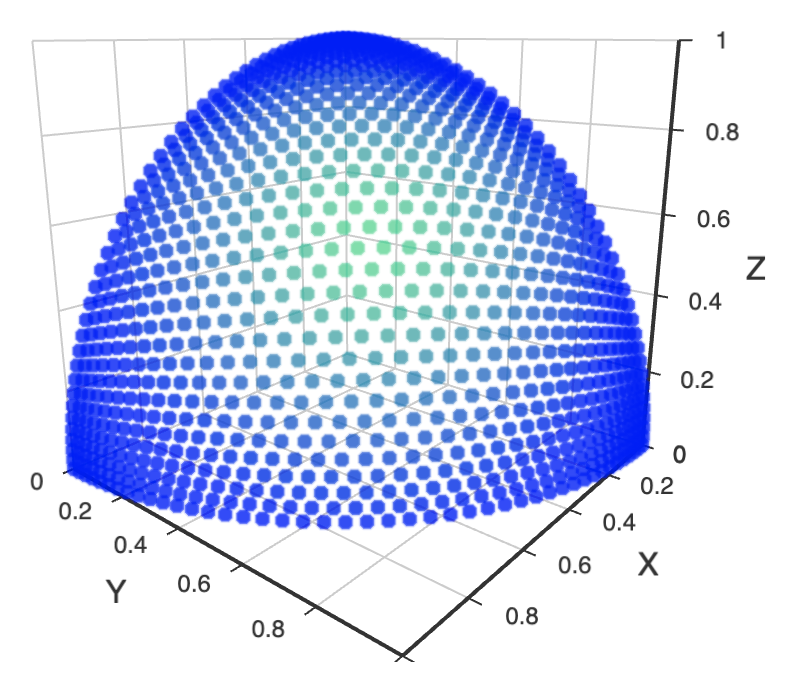
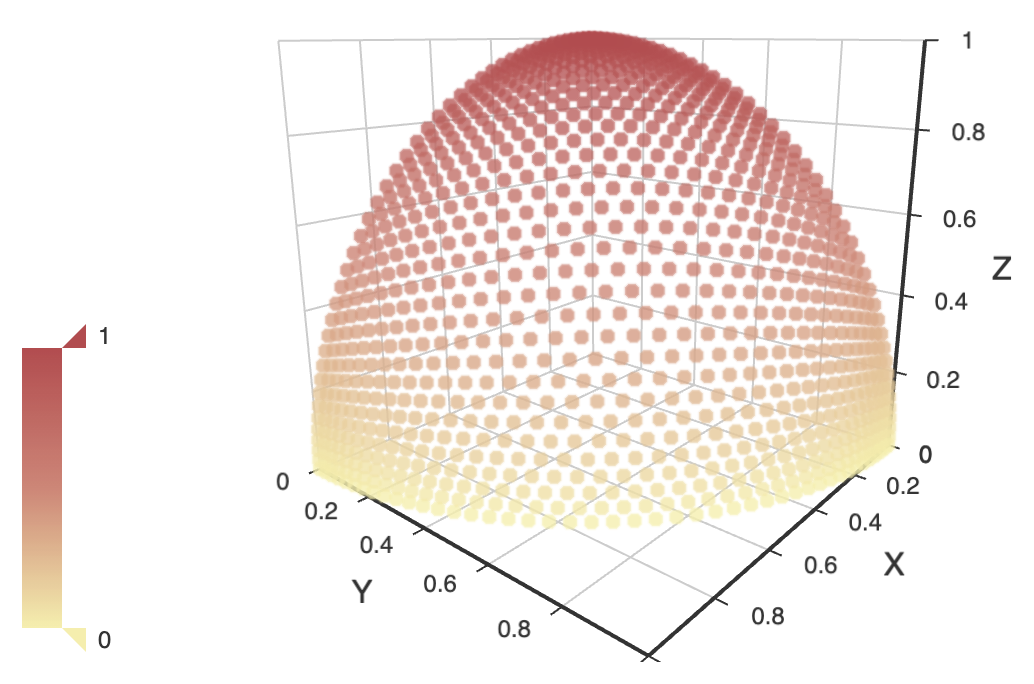
I want the same plot with a color-slider from the visualMap . So first I tried like this:
visualMap: {
        type: "continuous",
        seriesIndex: 0,
        min: 0,
        max: 1.0,
        color: (params) => {return colors[params.dataIndex];},
        calculable: true,
      },
and I'm getting this plot:
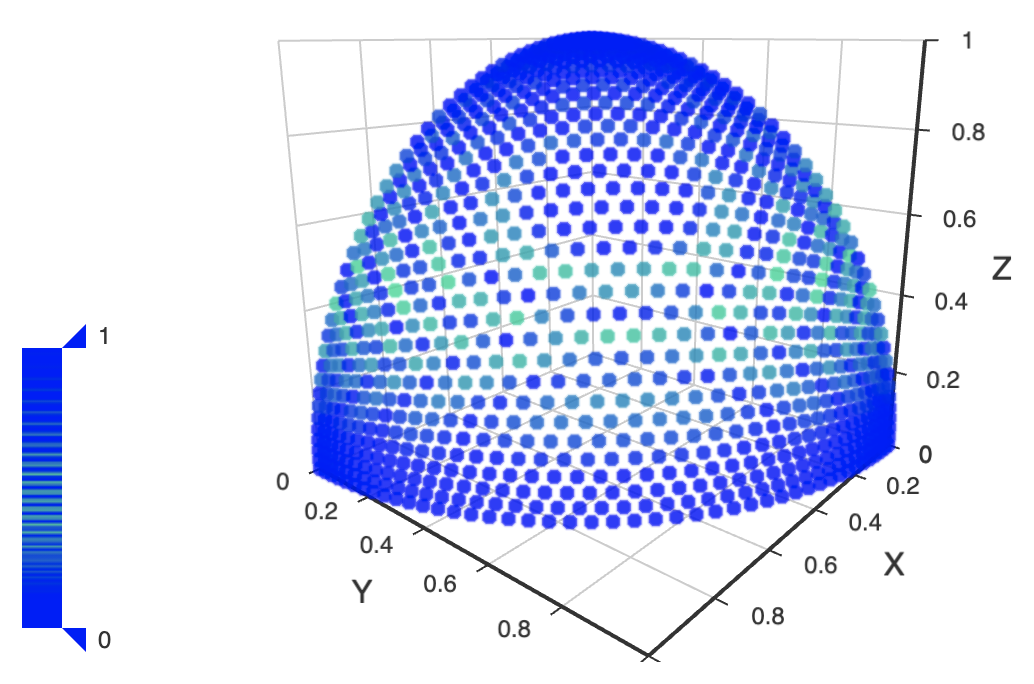
In the next attempt, I tried like this:
visualMap: {
        type: "continuous",
        seriesIndex: 0,
        min: 0,
        max: 1.0,
        color: colors,
        calculable: true,
      },
and I'm getting this plot:
What I want is keep the same coloring and a color slider provided by the visualMap.
Not sure if it's a bug or I'm not doing it in a correct way.
Hi! We've received your issue and please be patient to get responded. 🎉 The average response time is expected to be within one day for weekdays.
In the meanwhile, please make sure that you have posted enough image to demo your request. You may also check out the API and chart option to get the answer.
If you don't get helped for a long time (over a week) or have an urgent question to ask, you may also send an email to [email protected]. Please attach the issue link if it's a technical questions.
If you are interested in the project, you may also subscribe our mail list.
Have a nice day! 🍵
This issue has been automatically marked as stale because it did not have recent activity. It will be closed in 7 days if no further activity occurs. If you wish not to mark it as stale, please leave a comment in this issue.
This issue has been automatically closed because it did not have recent activity. If this remains to be a problem with the latest version of Apache ECharts, please open a new issue and link this to it. Thanks!
I believe this is still an issue in current versions. When trying to assign a color to each point of the 3d scatterplot the values get shuffled somehow.