OrderedPartitionableRecord buffer full, storing iterator and retrying
Today I've got very strange issue (not a first time actually) when all middlemanagers stopped to consume data from Kinesis stream for a long period (>40 minutes). The only message that was printed to tasks logs are these:
2019-12-10T21:36:22,218 INFO [appenderator_persist_0] org.apache.druid.segment.realtime.appenderator.StreamAppenderatorDriver - Successfully handed off [1] segments.
2019-12-10T21:36:27,100 WARN [KinesisRecordSupplier-Worker-18] org.apache.druid.indexing.kinesis.KinesisRecordSupplier - OrderedPartitionableRecord buffer full, storing iterator and retrying in [5,000ms]
.............
2019-12-10T21:40:21,249 WARN [KinesisRecordSupplier-Worker-13] org.apache.druid.indexing.kinesis.KinesisRecordSupplier - OrderedPartitionableRecord buffer full, storing iterator and retrying in [5,000ms]
2019-12-10T21:40:21,500 INFO [intermediary-data-manager-0] org.apache.druid.indexing.worker.IntermediaryDataManager - Discovered partitions for [0] new supervisor tasks under location[var/tmp/intermediary-segments]
2019-12-10T21:40:21,503 INFO [intermediary-data-manager-0] org.apache.druid.indexing.worker.IntermediaryDataManager - Found [0] expired supervisor tasks
.............
2019-12-10T21:50:39,061 WARN [HttpClient-Netty-Worker-3] org.apache.druid.java.util.http.client.pool.ResourcePool - Resource at key[http://prod-druid-overlord-0.prod-druid-overlord-headless.prod-druid.svc.cluster.local:8090] was returned multiple times?
2019-12-10T21:50:39,061 WARN [task-runner-0-priority-0] org.apache.druid.discovery.DruidLeaderClient - Request[http://prod-druid-overlord-0.prod-druid-overlord-headless.prod-druid.svc.cluster.local:8090/druid/indexer/v1/action] failed.
org.jboss.netty.handler.timeout.ReadTimeoutException
	at org.jboss.netty.handler.timeout.ReadTimeoutHandler.<clinit>(ReadTimeoutHandler.java:84) ~[netty-3.10.6.Final.jar:?]
	at org.apache.druid.java.util.http.client.NettyHttpClient.go(NettyHttpClient.java:172) ~[druid-core-0.16.0-incubating.jar:0.16.0-incubating]
	at org.apache.druid.java.util.http.client.AbstractHttpClient.go(AbstractHttpClient.java:33) ~[druid-core-0.16.0-incubating.jar:0.16.0-incubating]
	at org.apache.druid.discovery.DruidLeaderClient.go(DruidLeaderClient.java:173) ~[druid-server-0.16.0-incubating.jar:0.16.0-incubating]
	at org.apache.druid.discovery.DruidLeaderClient.go(DruidLeaderClient.java:145) ~[druid-server-0.16.0-incubating.jar:0.16.0-incubating]
	at org.apache.druid.query.lookup.LookupReferencesManager.fetchLookupsForTier(LookupReferencesManager.java:569) ~[druid-server-0.16.0-incubating.jar:0.16.0-incubating]
	at org.apache.druid.query.lookup.LookupReferencesManager.tryGetLookupListFromCoordinator(LookupReferencesManager.java:422) ~[druid-server-0.16.0-incubating.jar:0.16.0-incubating]
	at org.apache.druid.query.lookup.LookupReferencesManager.lambda$getLookupListFromCoordinator$4(LookupReferencesManager.java:400) ~[druid-server-0.16.0-incubating.jar:0.16.0-incubating]
	at org.apache.druid.java.util.common.RetryUtils.retry(RetryUtils.java:86) ~[druid-core-0.16.0-incubating.jar:0.16.0-incubating]
	at org.apache.druid.java.util.common.RetryUtils.retry(RetryUtils.java:114) ~[druid-core-0.16.0-incubating.jar:0.16.0-incubating]
	at org.apache.druid.java.util.common.RetryUtils.retry(RetryUtils.java:104) ~[druid-core-0.16.0-incubating.jar:0.16.0-incubating]
	at org.apache.druid.query.lookup.LookupReferencesManager.getLookupListFromCoordinator(LookupReferencesManager.java:390) ~[druid-server-0.16.0-incubating.jar:0.16.0-incubating]
	at org.apache.druid.query.lookup.LookupReferencesManager.getLookupsList(LookupReferencesManager.java:367) ~[druid-server-0.16.0-incubating.jar:0.16.0-incubating]
	at org.apache.druid.query.lookup.LookupReferencesManager.loadAllLookupsAndInitStateRef(LookupReferencesManager.java:350) ~[druid-server-0.16.0-incubating.jar:0.16.0-incubating]
	at org.apache.druid.query.lookup.LookupReferencesManager.start(LookupReferencesManager.java:156) ~[druid-server-0.16.0-incubating.jar:0.16.0-incubating]
	at sun.reflect.NativeMethodAccessorImpl.invoke0(Native Method) ~[?:1.8.0_202]
	at sun.reflect.NativeMethodAccessorImpl.invoke(NativeMethodAccessorImpl.java:62) ~[?:1.8.0_202]
	at sun.reflect.DelegatingMethodAccessorImpl.invoke(DelegatingMethodAccessorImpl.java:43) ~[?:1.8.0_202]
	at java.lang.reflect.Method.invoke(Method.java:498) ~[?:1.8.0_202]
	at org.apache.druid.java.util.common.lifecycle.Lifecycle$AnnotationBasedHandler.start(Lifecycle.java:442) ~[druid-core-0.16.0-incubating.jar:0.16.0-incubating]
	at org.apache.druid.java.util.common.lifecycle.Lifecycle.start(Lifecycle.java:339) ~[druid-core-0.16.0-incubating.jar:0.16.0-incubating]
	at org.apache.druid.guice.LifecycleModule$2.start(LifecycleModule.java:140) ~[druid-core-0.16.0-incubating.jar:0.16.0-incubating]
	at org.apache.druid.cli.GuiceRunnable.initLifecycle(GuiceRunnable.java:115) ~[druid-services-0.16.0-incubating.jar:0.16.0-incubating]
	at org.apache.druid.cli.CliPeon.run(CliPeon.java:273) ~[druid-services-0.16.0-incubating.jar:0.16.0-incubating]
	at org.apache.druid.cli.Main.main(Main.java:113) ~[druid-services-0.16.0-incubating.jar:0.16.0-incubating]
.............
2019-12-10T22:18:28,614 WARN [KinesisRecordSupplier-Worker-19] org.apache.druid.indexing.kinesis.KinesisRecordSupplier - OrderedPartitionableRecord buffer full, storing iterator and retrying in [5,000ms]
2019-12-10T22:18:29,343 INFO [task-runner-0-priority-0] org.apache.druid.segment.realtime.appenderator.BaseAppenderatorDriver - New segment[midas_2019-12-10T21:00:00.000Z_2019-12-10T22:00:00.000Z_2019-12-10T21:00:04.939Z_54] for row[MapBasedInputRow{timestamp=2019-12-10T21:35:33.144Z, event={app_id=............
Affected Version
0.16.0
Description
Please include as much detailed information about the problem as possible.
-
Cluster size 8 middlemanagers x 2 peons 1 overlord 1 coordinator
-
Steps to reproduce the problem happens sporadically, no issues reported from kinesis side (no throttling or other issues)
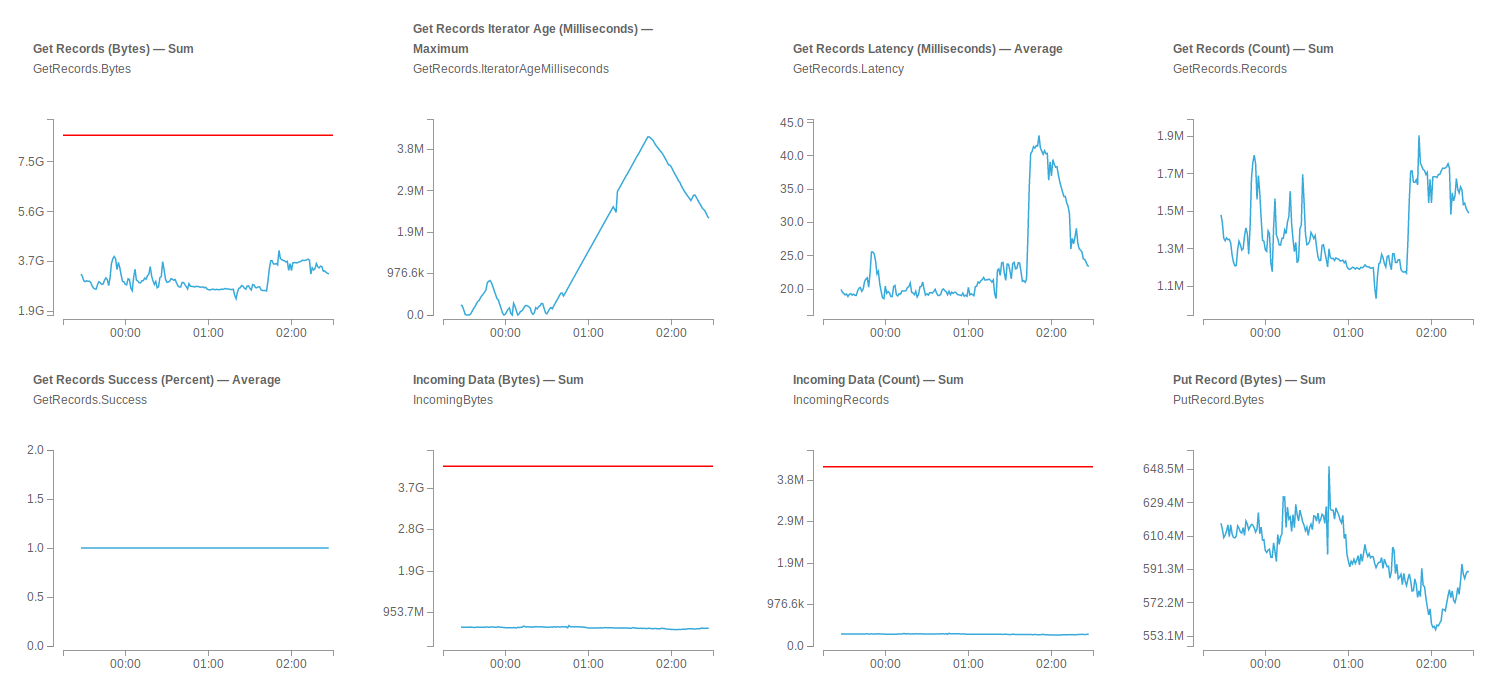
Relevant Kinesis metrics:
This issue has been marked as stale due to 280 days of inactivity. It will be closed in 4 weeks if no further activity occurs. If this issue is still relevant, please simply write any comment. Even if closed, you can still revive the issue at any time or discuss it on the [email protected] list. Thank you for your contributions.
We are also facing this issue with v0.22.1 and the message OrderedPartitionableRecord buffer full, storing iterator and retrying in [5,000ms] shows up repeatedly.
The only way to temporarily resolve it is to stop the supervisors, kill 1 in the middle-managers container, wait for it to be in-service again and resume supervisors.
We got this issue as well on 0.22.1
The root cause is that Coordinator stopped being responsive and various Polling loop starts throwing errors.
Looking at the 3 comments about issues here (from @didip, @applike-ss, & @dene14) it seems to me that the issues are probably related but different.
The original report by @dene14 has a really confusing log file. There is a message that a call to http://prod-druid-overlord-0.prod-druid-overlord-headless.prod-druid.svc.cluster.local:8090/druid/indexer/v1/action failed. But the following stack trace looks like a failed startup (note the Lifecycle.start). It should have come at the beginning of the log. And, at any rate, the stack trace is about a Coordinator API (note the LookupReferencesManager.fetchLookupsForTier: that's hitting the Coordinator) not an Overlord API. I wonder if the log got chopped up or went out-of-order somehow. The Kinesis metric timestamps also do not match the log timestamps, so it's hard to correlate these. It's been a long time since this report was filed, so I guess all the stuff required to debug it is long gone. This is unfortunate.
@applike-ss I'm interested in more information from task log files, if you have it. Kinesis metrics would be useful too. If they're in a different time zone from the log files, please let us know.
@didip Are you saying what happens is something like this?
- The Coordinator becomes unresponsive for some reason.
- Some time later, a new Kafka or Kinesis task starts up.
- The task can't finish starting up because the Coordinator is unresponsive.
- Ingestion falls behind, because the tasks can't start up.
Or are you saying that there is an issue where tasks that started up suddenly become unresponsive if the Coordinator has a problem?
Basically, I'm asking because I would expect the first case to happen: new processes (including tasks) can't start up if the Coordinator is unavailable and basic security is enabled. This is because they need to sync the user database from the Coordinator.
But, I wouldn't expect the second case to happen. If the Coordinator is unresponsive for some time while a task is running, it shouldn't prevent the task from making progress, unless the task is at a point where it needs to access some Coordinator API. Then, the task should basically sit there and wait for the Coordinator to come back.
Hi Gian!
First of all, I want to clarify, my problem revolves around batched ingestion. But it's almost the exact same stack trace.
Or are you saying that there is an issue where tasks that started up suddenly become unresponsive if the Coordinator has a problem?
From the perspective of batch ingestion, it's actually both. 97% of the time when Peon starts up it's fine. But when you have 1-2 thousands of Peons, a few of them will fail on boot when Coordinator becomes unresponsive. Unfortunately that's enough to bombed a few subtasks which in-turned bombed the entire index_parallel.
I see that you already replied to me on Slack, we can continue the conversation there and later on write up the solutions here.
On Fri, Jun 10, 2022 at 6:54 PM Gian Merlino @.***> wrote:
Looking at the 3 comments about issues here (from @didip https://github.com/didip, @applike-ss https://github.com/applike-ss, & @dene14 https://github.com/dene14) it seems to me that the issues are probably related but different.
The original report by @dene14 https://github.com/dene14 has a really confusing log file. There is a message that a call to http://prod-druid-overlord-0.prod-druid-overlord-headless.prod-druid.svc.cluster.local:8090/druid/indexer/v1/action failed. But the following stack trace looks like a failed startup (note the Lifecycle.start). It should have come at the beginning of the log. And, at any rate, the stack trace is about a Coordinator API (note the LookupReferencesManager.fetchLookupsForTier: that's hitting the Coordinator) not an Overlord API. I wonder if the log got chopped up or went out-of-order somehow. The Kinesis metric timestamps also do not match the log timestamps, so it's hard to correlate these. It's been a long time since this report was filed, so I guess all the stuff required to debug it is long gone. This is unfortunate.
@applike-ss https://github.com/applike-ss I'm interested in more information from task log files, if you have it. Kinesis metrics would be useful too. If they're in a different time zone from the log files, please let us know.
@didip https://github.com/didip Are you saying what happens is something like this?
- The Coordinator becomes unresponsive for some reason.
- Some time later, a new Kafka or Kinesis task starts up.
- The task can't finish starting up because the Coordinator is unresponsive.
- Ingestion falls behind, because the tasks can't start up.
Or are you saying that there is an issue where tasks that started up suddenly become unresponsive if the Coordinator has a problem?
Basically, I'm asking because I would expect the first case to happen: new processes (including tasks) can't start up if the Coordinator is unavailable and basic security is enabled. This is because they need to sync the user database from the Coordinator.
But, I wouldn't expect the second case to happen. If the Coordinator is unresponsive for some time while a task is running, it shouldn't prevent the task from making progress, unless the task is at a point where it needs to access some Coordinator API. Then, the task should basically sit there and wait for the Coordinator to come back.
— Reply to this email directly, view it on GitHub https://github.com/apache/druid/issues/9011#issuecomment-1152832935, or unsubscribe https://github.com/notifications/unsubscribe-auth/AAARZVS25HON34FVMFCR3WTVOPWWFANCNFSM4JZGF2DA . You are receiving this because you were mentioned.Message ID: @.***>
I think I see why the original log from @dene14 was so strange. The ReadTimeoutException is a liar! It is a static that is initialized once with a stack trace that matches whatever happened to first cause the class to get loaded up. But it
To make our logs more readable, we are going to need to wrap this. I raised a PR here: https://github.com/apache/druid/pull/12635
@gianm it happened again, however in the druid dashboard i can't get the logs (getting a 404 here, likely because the task is marked "failed"). We do log to elasticsearch as well and i can see logs from the task there, but i can not extract the logs and then put them into the issue. Anything i should search for?
@applike-ss could you please share how many open segments are present for a given task by searching for occurrences of "Announcing segment"?
Was this stream resharded within 24 hours of this task's run? Are there any WARN / ERROR logs or any errors related to AWS for this stream in the overlord's logs during this time?
Hi, at least the question about the number of segments I could answer right away: We have roughly 21 open segments per task. We're using daily segment granularity and are getting data for the last ~21 days.
Hi @j4k4, thanks for the response.
If this happens only at certain periods of time, it would be very helpful if you could confirm whether the stream had been resharded then. The supervisor may have AWS errors like LimitExceededException or ProvisionedThroughputExceededException in the overlord logs.
If this is a constant issue with ingesting this stream:
- Could you please try a short ingestion with the same stream to a temporary datasource with a coarser segment granularity (1 month?) and see if it persists?
- What is the frequency at which this log appears for the same thread?
@applike-ss could you please share how many open segments are present for a given task by searching for occurrences of "Announcing segment"?
Was this stream resharded within 24 hours of this task's run? Are there any WARN / ERROR logs or any errors related to AWS for this stream in the overlord's logs during this time?
AFAIK the stream was not resharded anytime lately.
In regards to errors we do not get any until we stop the supervisor to exchange middle-manager and coordinators to make the system work again.
Warnings we get these:
-
[GET http://10.11.178.110:8100/druid-internal/v1/segments?counter=24&hash=1658707907926&timeout=240000] Channel disconnected before response complete -
skipInterval[2022-07-25T00:00:00.000Z/2022-07-26T00:00:00.000Z] is not contained in remainingInterval[2019-01-01T00:00:00.000Z/2022-07-25T00:00:00.000Z] -
Exception in supervisor run loop for dataSource [<datasource_name>] -
Exception while getting current/latest sequences(with error.messagecom.amazonaws.services.kinesis.model.ProvisionedThroughputExceededException: Rate exceeded for shard shardId-000000000056 in stream <stream_name> under account <account_id>. (Service: AmazonKinesis; Status Code: 400; Error Code: ProvisionedThroughputExceededException; Request ID: <aws_request_id>; Proxy: null))
@AmatyaAvadhanula which insight will point 1 give us? and which specific log do you refer to for point 2?
@j4k4 what do you think about also ingesting into a temporary datasource with coardser segment granularity? Do you want to try it?
@applike-ss
- The number of open segments may sometimes lead to a slower rate of ingestion than the rate at which records are consumed from kinesis. If a coarser granularity works, we could try changing a few values in the tuning config to see if it helps.
- I was referring to the log
OrderedPartitionableRecord buffer full, storing iterator and retrying
Thanks for explaining! The marked part is where the issues start. As you can see it happens for hours, but before that it's fine for a day in this screenshot. So my assumption is that our setup in general would be fast enough (also with the amount of segments). However it may very well be that i lack some knowledge that makes my statement invalid and in that case i will happily listen to your feedback :-)

@applike-ss, it does seem unlikely that it is because of open segments. Could you please help with a few more details?
- Is the shard
shardId-000000000056present in any of the logs before this period [25/07 00:00]? When is its earliest occurrence? - Do the supervisor exceptions occur around the same time? [25/07 00:00]
- The stacktrace corresponding to the
Exception in supervisor run loop for dataSourcelogs would be very helpful as well.
- yes, at least 5 days before that
- The first
OrderedPartitionableRecorderror message happened at "2022-07-25 00:08:09.389", the first exception with messageException in supervisor run loop for dataSourcewas at "2022-07-25 00:27:05.724" - Here you go:
java.util.concurrent.TimeoutException: Timeout waiting for task.
	at com.google.common.util.concurrent.AbstractFuture$Sync.get(AbstractFuture.java:269)
	at com.google.common.util.concurrent.AbstractFuture.get(AbstractFuture.java:96)
	at org.apache.druid.indexing.seekablestream.supervisor.SeekableStreamSupervisor.checkTaskDuration(SeekableStreamSupervisor.java:2618)
	at org.apache.druid.indexing.seekablestream.supervisor.SeekableStreamSupervisor.runInternal(SeekableStreamSupervisor.java:1270)
	at org.apache.druid.indexing.seekablestream.supervisor.SeekableStreamSupervisor$RunNotice.handle(SeekableStreamSupervisor.java:333)
	at org.apache.druid.indexing.seekablestream.supervisor.SeekableStreamSupervisor.lambda$tryInit$3(SeekableStreamSupervisor.java:952)
	at java.util.concurrent.Executors$RunnableAdapter.call(Executors.java:511)
	at java.util.concurrent.FutureTask.run(FutureTask.java:266)
	at java.util.concurrent.ThreadPoolExecutor.runWorker(ThreadPoolExecutor.java:1149)
	at java.util.concurrent.ThreadPoolExecutor$Worker.run(ThreadPoolExecutor.java:624)
	at java.lang.Thread.run(Thread.java:748)
We MIGHT have found out what was causing this on our side. It's still maybe a bit too early to celebrate, but we haven't had issues since quite some days now. We were using a logging configuration that was not exactly elegant. Our log4j was configured to use the HttpAppender to write logs to our log router. This from time to time could fail due to network issues and resulted in an http exception within log4j. Since we adjusted our strategy here, we haven't had a single hickup related to data ingestion. Maybe this helps the original issue author as well?
EDIT (17.08.2022): Still everything is running stable :+1:
EDIT (06.09.2022): Still everything is running stable :+1:
EDIT (16.09.2022): Still everything is running stable :+1:
EDIT (19.10.2022): Still everything is running stable :+1:
This issue has been marked as stale due to 280 days of inactivity. It will be closed in 4 weeks if no further activity occurs. If this issue is still relevant, please simply write any comment. Even if closed, you can still revive the issue at any time or discuss it on the [email protected] list. Thank you for your contributions.
This issue has been closed due to lack of activity. If you think that is incorrect, or the issue requires additional review, you can revive the issue at any time.