🦋 Collect ecological projects and products 收集社区生态项目
Collect ecological projects and products, and we will recommend them in Issue and README to provide users with better technical solutions.
收集生态项目和产品,我们会放到 Issue 和 README 推荐,给用户更好的技术方案。
The format of the introduction text is as follows:
介绍文本的格式如下:
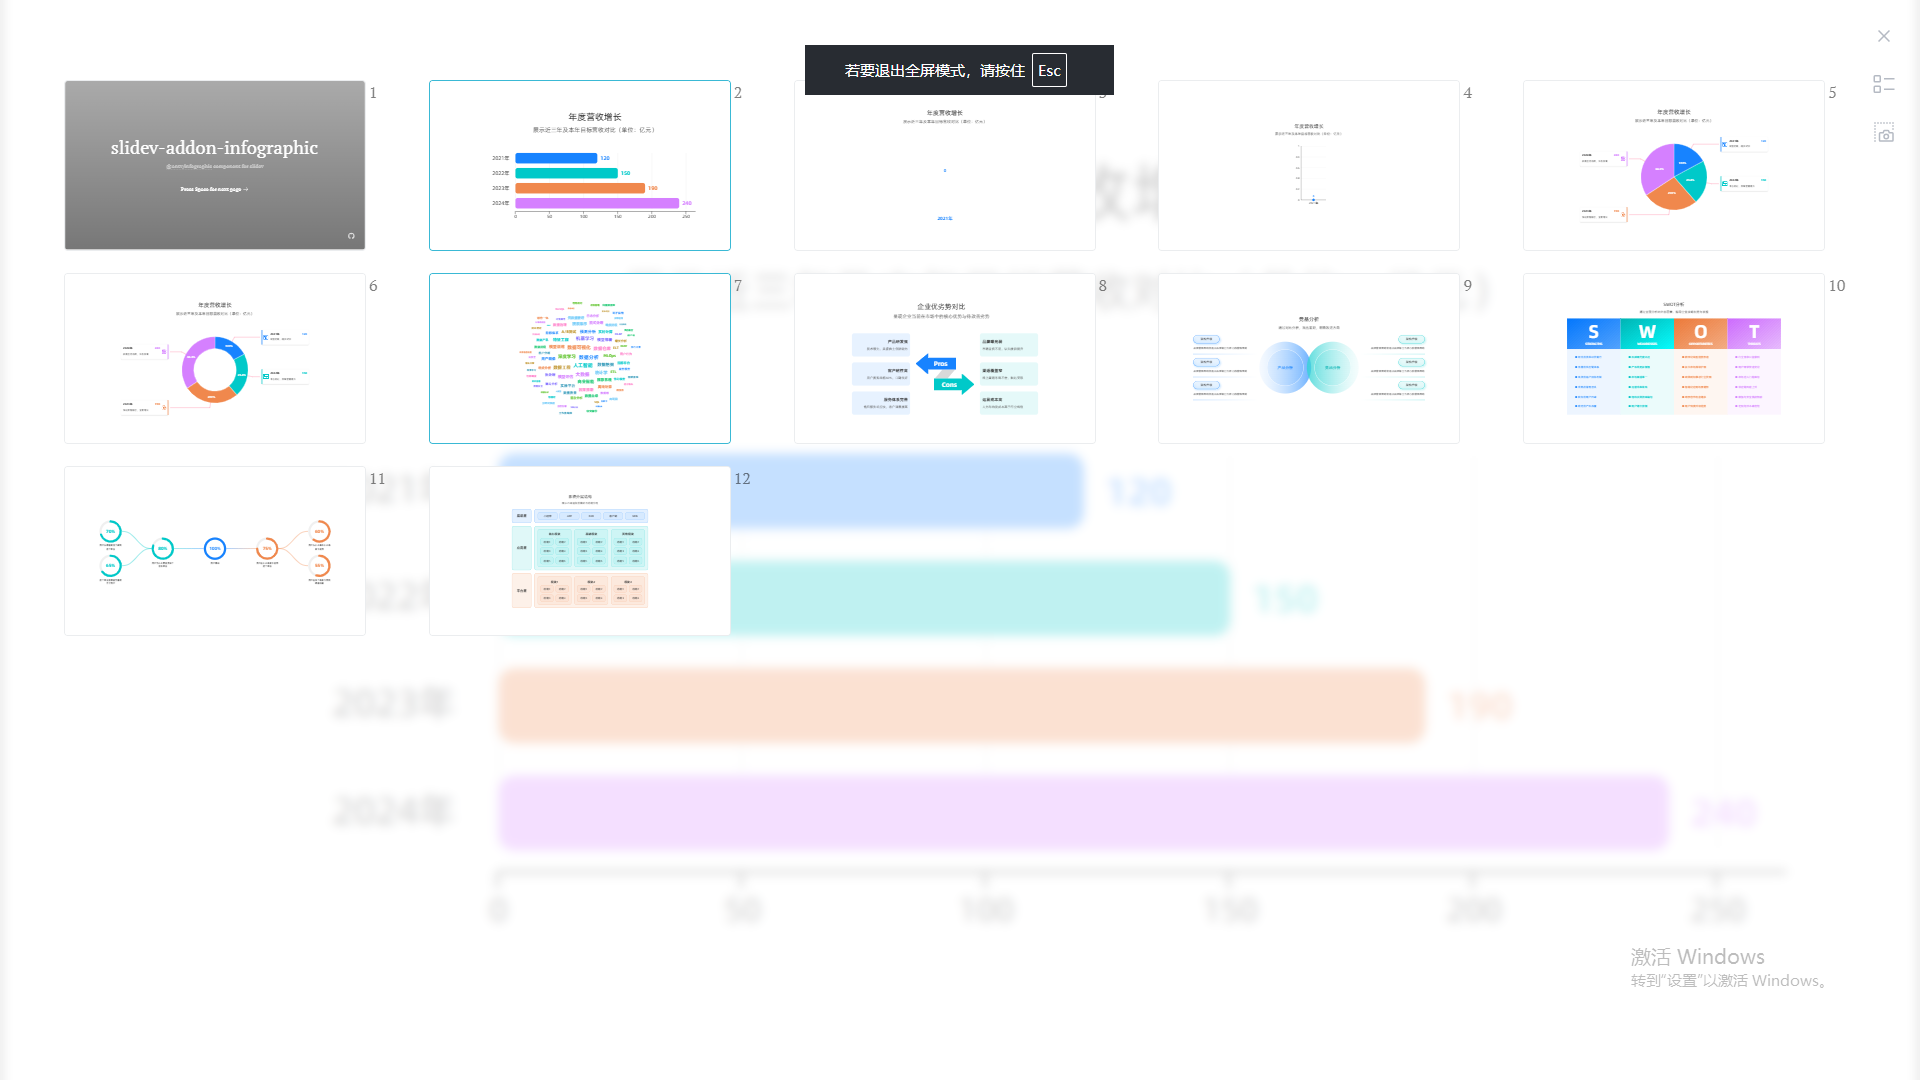
### <img height="24px" src="https://zojo.ai/zojo-logo.svg" />   [Create Beautiful Infographics](https://zojo.ai/infographic)

> Powered by AntV Infographic - Generate professional infographics with simple syntax.

<img width="1956" height="2244" alt="Image" src="https://github.com/user-attachments/assets/7aa29b28-2314-4024-9d70-1a9624a87fac" />
 Create Beautiful Infographics
Powered by AntV Infographic - Generate professional infographics with simple syntax.
 A VSCode extension that preview Infographic in Markdown
Create infographic visualizations in your Markdown files using code blocks with the infographic language identifier.
 A Chrome extension to view Markdown files with syntax highlighting
Write in Markdown, export to perfect Word docuemnt with one click. You can perfectly use marmaid/vega/Infographic in Word documents.
 A Memory Bank Keeps AI chats, tools, notes, agents, and files you choose in one private memory on your computer.
Nowledge Mem's Built-in AI Agent is based on a Harness SWE Agent with Polished Skills and Plugins to do many works with all your memories, yet its Presentation Creator Plugin can compose Slides(with built-in edit and export) that's with Chart, FlowChart and Now InfoGraphic.
 LangChat Slides - Next-Gen AI Slide Generator
LangChat Slides is one of the flagship products of LangChat Pro, leveraging the powerful model capabilities of LangChat and the visualization engine of @antv/infographic. Users can simply input natural language descriptions to instantly generate clear, well-designed infographic slides.
 astro-koharu
astro-koharu is a cute and anime blog theme with a pink and blue color scheme. It is inspired by the Shoka theme of Hexo and supports Infographic rendering. Infographic 信息图指南 demonstrates a variety of grammar.
 Welight: Beautiful layouts have always been simple.
Welight is an all-in-one software platform that integrates WeChat official account article creation, editing, formatting, and publishing. Your WeChat official account creation journey can be very simple. In our upcoming latest version, we have completed the generation and editing features for Infographic. You can insert these infographics into your WeChat official account articles at any time, or download the images separately to your local device.
 Alma: Elegant AI Provider Orchestration
A beautiful desktop application that unifies your AI experience. Seamlessly switch between OpenAI, Anthropic, Google Gemini, and custom providers.
markstream-vue
Fast, streaming-friendly Markdown rendering for Vue 3 — progressive Mermaid, streaming diff code blocks, and real-time previews optimized for large documents.
 微信 Markdown 编辑器
Markdown 文档自动即时渲染为微信图文,让你不再为微信内容排版而发愁!只要你会基本的 Markdown 语法(现在有了 AI,你甚至不需要会 Markdown),就能做出一篇样式简洁而又美观大方的微信图文。
markdown-it Infographics
markdown-it plugin for @antv/Infographic.
const md = require('markdown-it')()
const infographic = require('markdown-it-infographic')

md.use(infographic)

md.use(infographic, {
  padding: 4
})
 feffery infographic
Create infographics in Python, Based on the Plotly Dash framework.
import dash
from dash import html
import feffery_infographic as fi

app = dash.Dash(__name__)

app.layout = html.Div(
    [
        fi.Infographic(
            # 定义信息图语法
            syntax="""
infographic list-row-simple-horizontal-arrow
data
  items
    - label 步骤 1
      desc 开始
    - label 步骤 2
      desc 进行中
    - label 步骤 3
      desc 完成
""",
        )
    ],
    style={'padding': 50},
)

if __name__ == '__main__':
    app.run(debug=True)
infographic-for-react React Infographic Component
React components for @antv/infographic - 声明式、基于组件的 React 封装,支持 Hooks,用于信息图生成。
import { Infographic } from 'infographic-for-react';

function App() {
  return (
    <Infographic width={600} height={400}>{`infographic list-row-simple-horizontal-arrow
data
  items
    - label Step 1
      desc Start
    - label Step 2
      desc In Progress
    - label Step 3
      desc Complete
`}
    </Infographic>
  );
}
轻量级 React 封装,提供声明式 API、TypeScript 类型支持、以及 beforeRender / afterRender 钩子,让 React 开发者能以熟悉的方式使用 AntV Infographic。支持 DSL 路径覆盖、导出 SVG / PNG、错误边界等功能。
infographic-cli Command-Line Infographic Generator
CLI tool for @antv/infographic - 命令行工具,通过简单的声明式语法快速生成精美的 SVG 信息图,支持从字符串、文件或标准输入渲染。
# 安装
npm install -g infographic-cli

# 从 DSL 字符串快速生成
ifgc -s "infographic list-row-simple-horizontal-arrow
data
  title My First Infographic
  items
    - label Step 1
      desc Start
    - label Step 2
      desc In Progress
    - label Step 3
      desc Complete" -o output.svg

# 从文件生成
ifgc -i input.ifgc -o output.svg

# 使用主题
ifgc -i diagram.ifgc -o output.svg -t dark

# 从管道输入
cat input.ifgc | ifgc -o output.svg
轻量级命令行工具,提供简洁的 CLI API、支持字符串/文件/stdin 多种输入方式、JSON 配置文件、主题系统,让开发者能以高效的方式集成到构建流程中。支持模板列表查询、静默模式等功能。输出 SVG 矢量格式,完美适配 Web、文档、设计工具等场景。
docsify-infographic A plugin to render @antv/infographic diagrams in docsify
Powered by AntV Infographic
使用方法
在 docsify 中添加 Infographic 和插件:
<script>
  window.$docsify = {
    infographicConfig: {
      width: '100%',
      height: '100%'
    }
  };
</script>

<!-- 加载 AntV Infographic -->
<script src="https://unpkg.com/@antv/infographic@latest/dist/infographic.min.js"></script>
<!-- 加载插件 -->
<script src="https://unpkg.com/docsify-infographic@latest/dist/docsify-infographic.js"></script>
使用infographic语言标记代码块,还支持自定义图例尺寸
        ```infographic 60%*300px
            infographic_codes...
        ```
InfographicAI 基于信息图生成 PPT
github: https://github.com/tuntun0609/infographic-ai
Powered by AntV Infographic - 使用信息图生成 PPT 工具,支持 PPT发布 、下载 PPT、AI 辅助、可视化编辑器 等功能