label customized text on ax.scatter 3D graph, the index is wrong
When using
 The tested index is wrong, the order is wrong.
for example, in the following graph:
 the content in the table is correct, when id is 3, value should be 230, but in the graph, the annotated text for id 3 is the value of id 1. The order is messed up
Please provide a short, self-contained code snippet to reproduce the bug, ideally allowing a simple copy and paste to reproduce. Please do your best to reduce the code snippet to the minimum required. (https://matplotlib.org/stable/devel/contributing.html#submitting-a-bug-report)
did not get the exact result, but reproduced a similar error that has something wrong with indexing:
import matplotlib.pyplot as plt
import mplcursors
import numpy as np
fig = plt.figure()
ax = fig.add_subplot(111, projection='3d')
labels = ["a", "b", "c", "d", "e"]
x = [0,1,2,3,4]
y = [0,1,2,3,4]
z = [0,1,2,3,4]

color_list = ['red','orange','blue','blue','green']
ax.scatter(x,y,z, c=color_list, alpha=1)


# line, = ax.plot(x, x, "ro")
mplcursors.cursor(ax, hover=True).connect(
    "add", lambda sel: sel.annotation.set_text(labels[sel.index]))

plt.show()
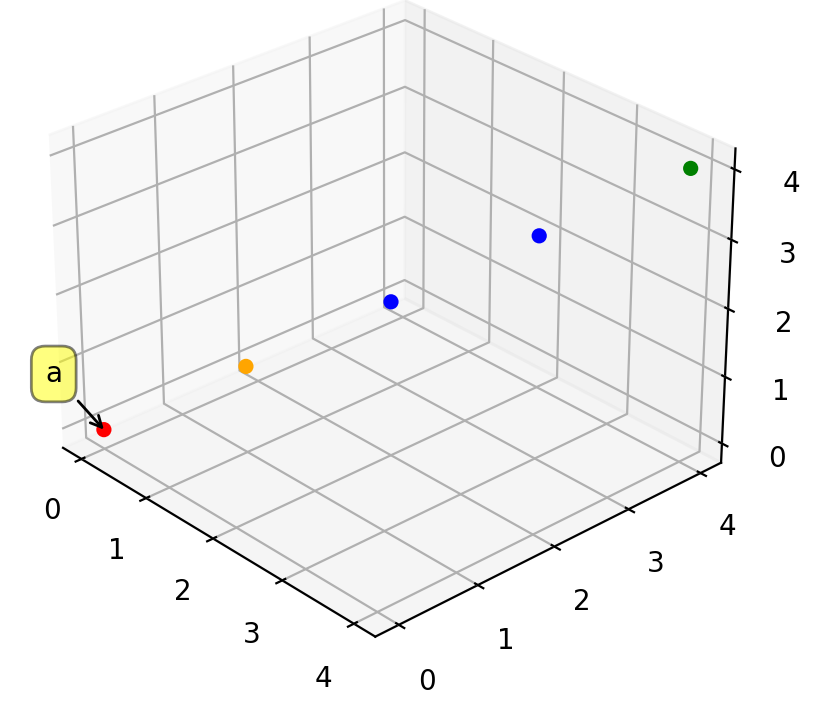
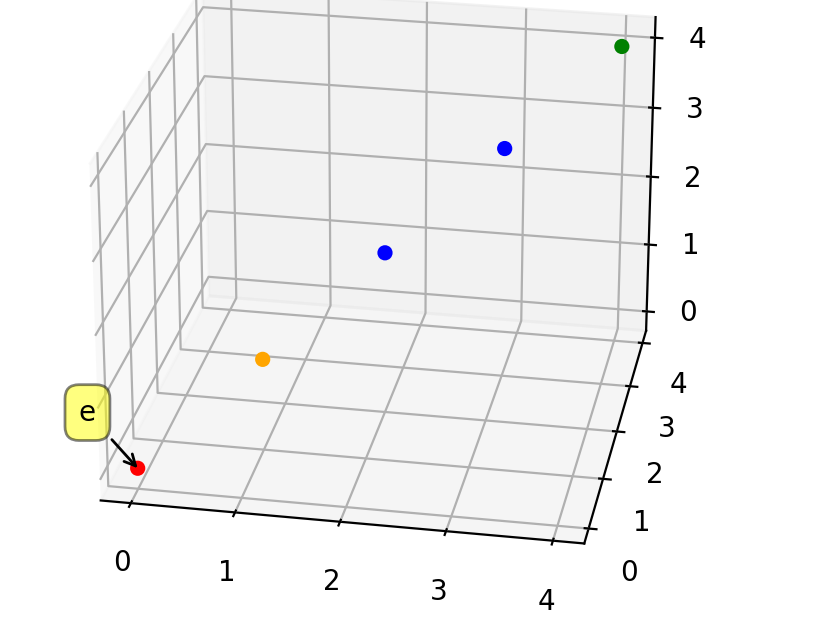
The result should be a, b, c, d, e shown when clicking from (0,0), (1,1), (2,2), (3,3),(4,4), but if you rotate the graph a little bit, the annotated text will be different
Before rotating:
after rotating
Ah, I see, thanks for the report. I can reproduce the problem, but AFAICT this needs to be solved on Matplotlib's side, specifically via something like https://github.com/matplotlib/matplotlib/issues/23155.
Thank you , while this is being solved, are there any alternatives? For example, can I use a dictionary with (x,y,z) as key and tag as value? How can I get x, y, z from the lambda sel?
Unfortunately I do not think this is possible right now; if you check the matplotlib issue tracker iirc there are a few other open issues about the difficulty to retrieve 3d coordinates from interactive events.
I believe this is fixed by https://github.com/matplotlib/matplotlib/pull/24491 (which will be present in the future matplotlib 3.7 release).