Cannot set axis.line limit correctly
I would like a y axis line with tick marks beside the dendrogram. It should start at 0 and end at the y max, similar to the base plotting behavior. However, nothing I've tried works. The line runs past the y limits I set. Running a little past the y max is ok (as the base example does) but I would really like it to start at 0. How can I make this work?
hc <- hclust(dist(mtcars))
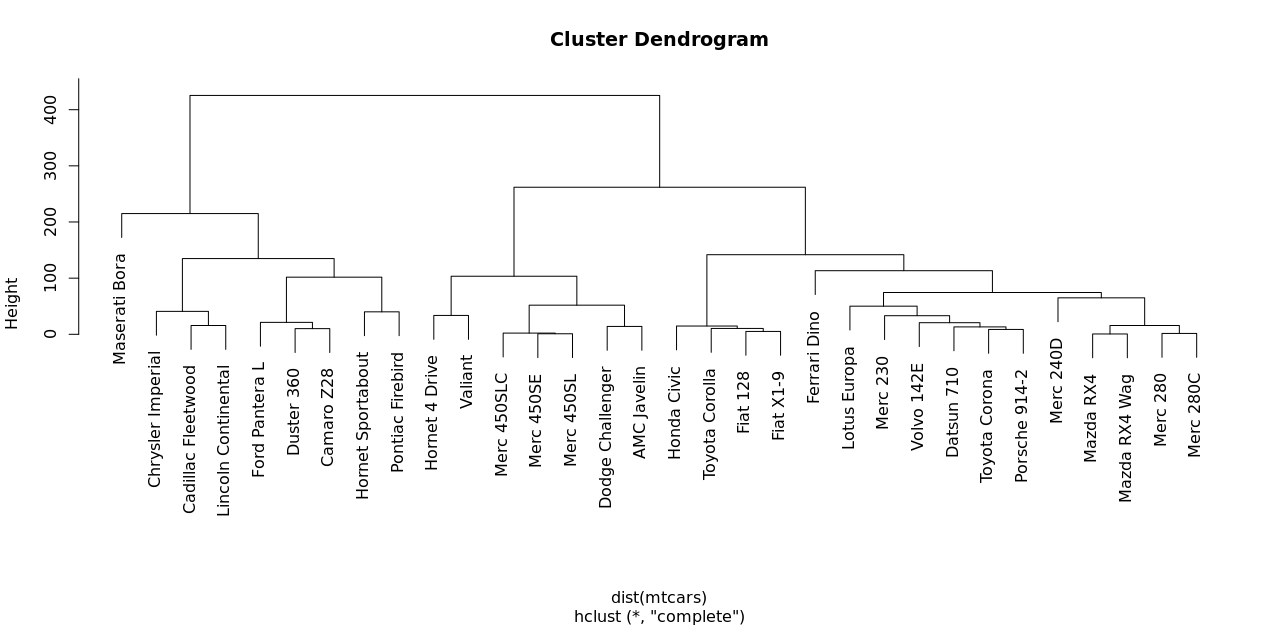
# Base example
plot(hc)
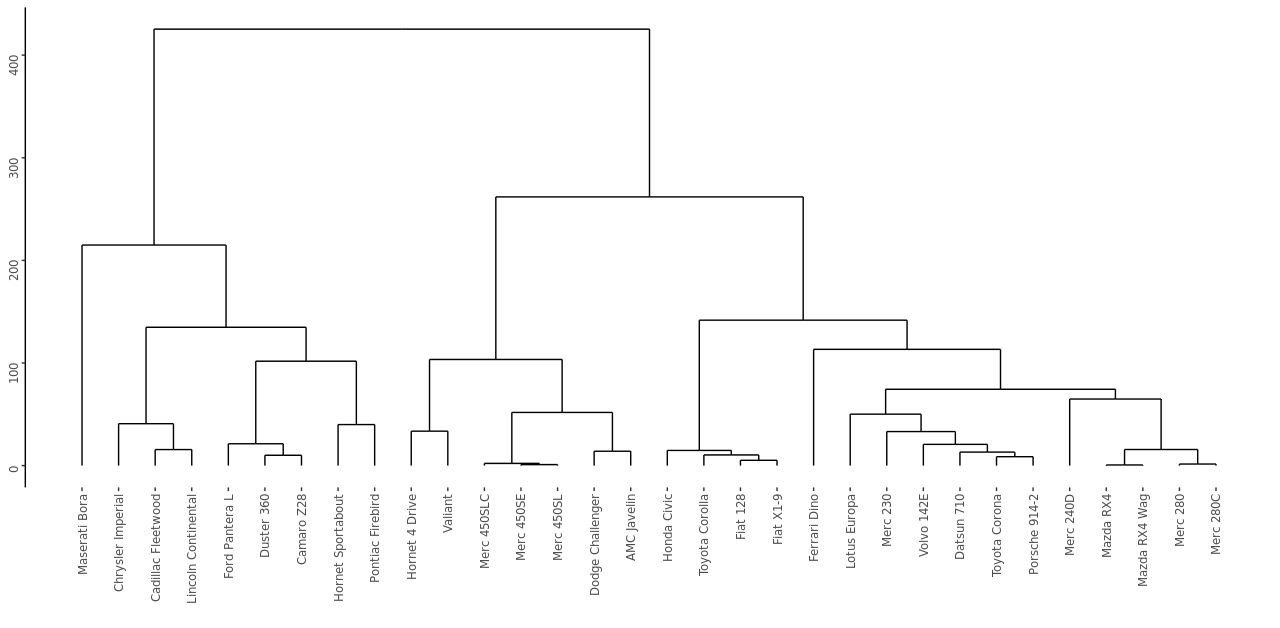
# ggdendrogram
ggdendrogram(hc) +
  coord_cartesian(ylim = c(0, max(hc$height))) +
  theme(
    axis.line.y = element_line(),
    axis.ticks = element_line()
  )
Sorry for asking, but why would you prefer to do it with ggdendro over dendextend? https://cran.r-project.org/web/packages/dendextend/vignettes/dendextend.html#ggplot2-integration
@talgalili I don't have a preference as long as it's ggplot. If there's an easy way to add an axis line to a dendrogram similar to base plot using dendextend please let me know. In this case I'm asking specifically about ggdendro.
I'm not sure I follow, you show an example of how you've done it with code. Is that solution not good for you? Are you looking for another solution?
On Fri, Oct 8, 2021 at 11:45 PM Joseph Ernest @.***> wrote:
@talgalili https://github.com/talgalili I don't have a preference as long as it's ggplot. If there's an easy way to add an axis line to a dendrogram similar to base plot using dendextend please let me know. In this case I'm asking specifically about ggdendro.
— You are receiving this because you were mentioned. Reply to this email directly, view it on GitHub https://github.com/andrie/ggdendro/issues/32#issuecomment-939105948, or unsubscribe https://github.com/notifications/unsubscribe-auth/AAHOJBUR64FFLFO7G6SOZB3UF5J5RANCNFSM5FNHERJQ . Triage notifications on the go with GitHub Mobile for iOS https://apps.apple.com/app/apple-store/id1477376905?ct=notification-email&mt=8&pt=524675 or Android https://play.google.com/store/apps/details?id=com.github.android&referrer=utm_campaign%3Dnotification-email%26utm_medium%3Demail%26utm_source%3Dgithub.
@talgalili I want the y axis to end at 0 like the base plot example. Notice how with ggdendro the y axis runs past 0.