Plotting issue for adjusting axis scale
Hi Andrew, I hope you're doing well! I noticed some strange behaviour, when trying to adjust the Y axis in calibrated plots, where the HDR ends up floating around? I'm not sure if it's possible to resolve this?
I tried to adjust using: ylim(c(X,XX), scale_y_continuous(name = "14C Age", limits = c(X,XX)), and expand_limits(y = c(X,XX)), with all either yielding the same issue or no change to the original plot.
Many thanks in advance for any help or guidance you can offer on the issue.
Code for reproducing the issue: `
Load packages
library(Bchron) library(ggplot2)
Calibrate a single age
ages1 <- BchronCalibrate( ages = 11553, ageSds = 230, calCurves = "intcal20", ids = "Date-1" )
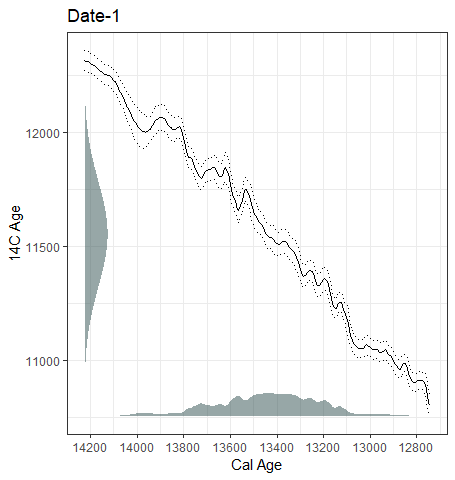
Nice looking plot:
plot(ages1, includeCal = TRUE)
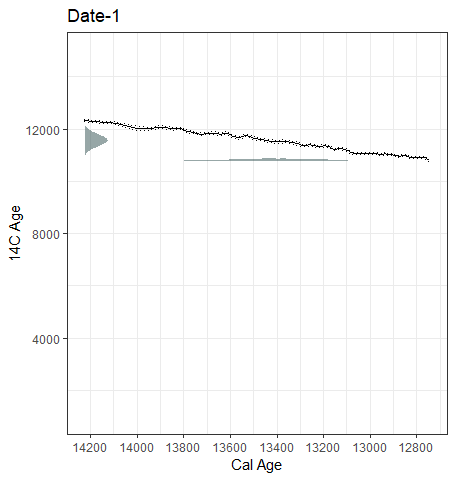
Funny plot, with the HDR floating instead of down on the x-axis as expected
plot(ages1, includeCal = TRUE) + scale_y_continuous(name = "14C Age", limits = c(1000,15000)) `
Example images:
Nice plot:
Funny plot:
(Many thanks to @benmarwick for creating this example chunk to show the problem!)