altair
 altair copied to clipboard
hoursminutes encoding of time doesn't follow order around midnight when multiple days are stacked
I'm trying to stack 'hoursminutes' as an encoding across multiple days, but if there's a timestamp around midnight, the ordering gets changed. I also tried with T encodings on just the column, but it starts at midnight on the left. I'd like the text to also show the hours:minutes on the x-axis. Is there a way to use the pickup_datetime_1min or sequence columns for ordering, but show the hoursminutes as the text while stacking on them? Or can the scale be forced to be in a certain order? Thank you very much!
import altair as alt
from datetime import datetime, timedelta

b = datetime(2010, 6, 9, 0, 5, 0)
b_ts = [b] * 12

d1s = datetime(2010, 6, 1, 23, 50, 0)
d2s = datetime(2010, 6, 8, 23, 50, 0)
d3s = datetime(2010, 6, 15, 23, 50, 0)

pickup_datetime_1min = [d1s, d1s + timedelta(minutes=10), d1s + timedelta(minutes=20), d1s + timedelta(minutes=30) ] + \
                        [d2s, d2s + timedelta(minutes=10), d2s + timedelta(minutes=20), d2s + timedelta(minutes=30) ] + \
                        [d3s, d3s + timedelta(minutes=10), d3s + timedelta(minutes=20), d3s + timedelta(minutes=30) ]

rides_per_minute = [10,12,14,16] + [12,14,16,18] + [14,16,18,20]

which_week = ["Week before"] * 4 + ['Current week'] * 4 + ['Week after'] * 4

sequence = [1,2,3,4] * 3

list_of_tuples = list(zip(b_ts, pickup_datetime_1min, rides_per_minute, which_week, sequence))

dff = pd.DataFrame(list_of_tuples,
                  columns = ['b_ts', 'pickup_datetime_1min', 'rides_per_minute', 'which_week', 'sequence'])

dff

line = alt.Chart(pd.DataFrame({'x': [b]})).mark_rule().encode(x=alt.X('hoursminutes(x):O', title='') )
#line = alt.Chart(pd.DataFrame({'x': [b]})).mark_rule().encode(x=alt.X('x:T', title='') )

# https://altair-viz.github.io/user_guide/times_and_dates.html
rides = alt.Chart(dff, title="Rides around " + str(b.strftime('%A')) + ' - ' + str(b)).mark_line().encode(
    #x=alt.X('hoursminutes(pickup_datetime_1min):Q', title='Date/time',
    x=alt.X('hoursminutes(pickup_datetime_1min):O', title='Date/time',

           ),
    #x=alt.X('sequence:Q', axis=None, title='Date/time' ),
    y=alt.Y('rides_per_minute:Q', title='Rides per minute'),
    color=alt.Color('which_week:N', title='Which week', scale=alt.Scale(
                                            domain=['Week before', 'Current week', 'Week after'],
                                            range=['#c0c0c0 ', '#fff400', '#adc0d8']))
).properties(
width=700,
    height=250
).interactive()

(rides+line).display()

You probable need utchoursminutes, where you currently use hoursminutes:

See for more info: https://altair-viz.github.io/user_guide/times_and_dates.html.
Thank you @mattijn , I just tried that and it worked for the code I posted, but not for my actual data, I'm not sure why yet... with an 'O' encoding I get this:
 and a 'T' encoding I get this:
 Would you have any ideas why?
Its confusing why the behaviour of UTC dates is different between ordinal and temporal type:
import pandas as pd
from datetime import datetime, timezone
import altair as alt

utc_date = datetime(2010, 6, 9, 0, 5, 0, tzinfo=timezone.utc)
df_utc = pd.DataFrame({'x': [utc_date]})
print(f'utc_date: {utc_date}')

utc_O = alt.Chart(df_utc, title='Ordinal').mark_rule().encode(x=alt.X('utchoursminutes(x):O'))
utc_T = alt.Chart(df_utc, title='Temporal').mark_rule().encode(x=alt.X('utchoursminutes(x):T'))

utc_O | utc_T
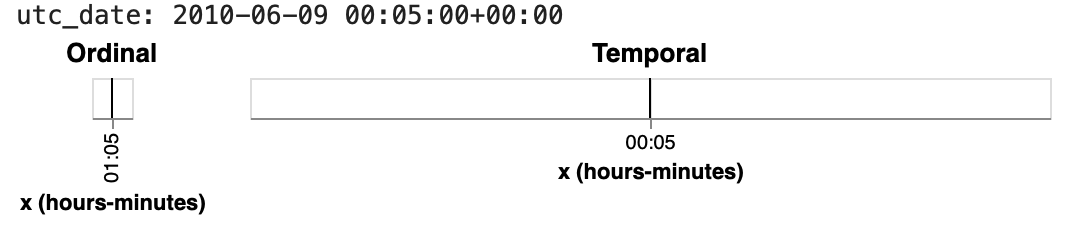
UTC dates encoded as an ordinal type, still seems to be parsed in the local timezone of the browser. It feels as a bug, but maybe its a feature of Vega-Lite..
Behaviour still occurs in VL5: Open the Chart in the Vega Editor
Since this is an issue in Vega-Lite, the best course of action would be to open an issue there. Closing since it can't be fixed in altair directly.