Igor Alshannikov
Igor Alshannikov
The 1st chart tells you that some time in December the value was near 6. To know when was it, you need to configure more detailed formatting, for example: `format="%b...
See discussion https://github.com/JetBrains/lets-plot/discussions/952
Hi @OSuwaidi , since 4.3.0 radar/spider plots are supported via `coord_polar()` + "flat" option: - https://nbviewer.org/github/JetBrains/lets-plot/blob/master/docs/f-24a/coord_polar.ipynb - https://nbviewer.org/github/JetBrains/lets-plot-docs/blob/master/source/examples/demo/palmer_penguins.ipynb
Maybe related to #600
Available in [v4.4.0](https://github.com/JetBrains/lets-plot?tab=readme-ov-file#what-is-new-in-440).
Hi @bric3 , thanks for suggestion. We didn't consider JSVG for SVG rendering but it might be worth it to take a look. Our crucial requirement to such a framework...
This is about interactivity yes. Batik observes/reacts to any change in SVG: all properties and adding/removing of elements. We use this stuff to update content in tooltips and move them...
Maybe we could add support for a limited set of transformation expressions. Could you describe your use-case?
Related - "windrose" formatting: 
ggplot (r) can show n/a values in legend (not sure about colorbar): 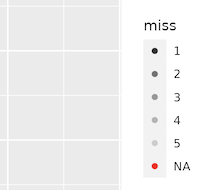 https://ggplot2.tidyverse.org/reference/scale_grey.html