grafana-flowcharting
 grafana-flowcharting copied to clipboard
Version 1.0.0d / Grafana 8.5.6: queries with multiple result fields cannot be used
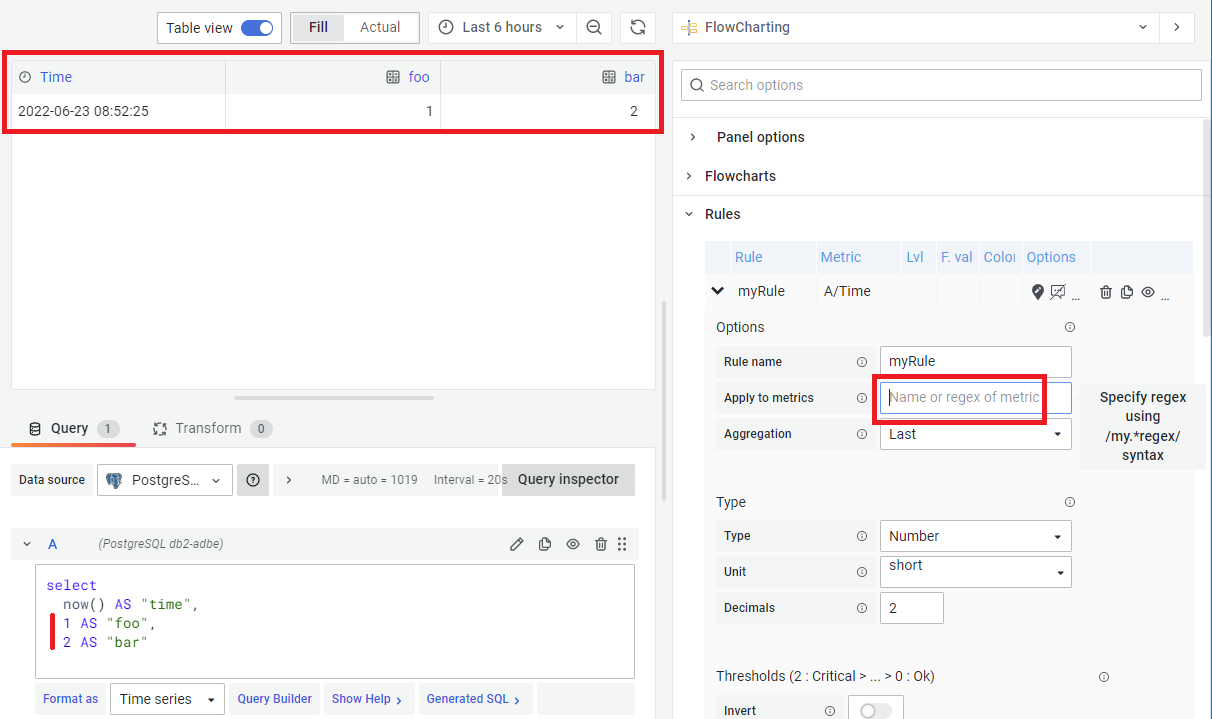
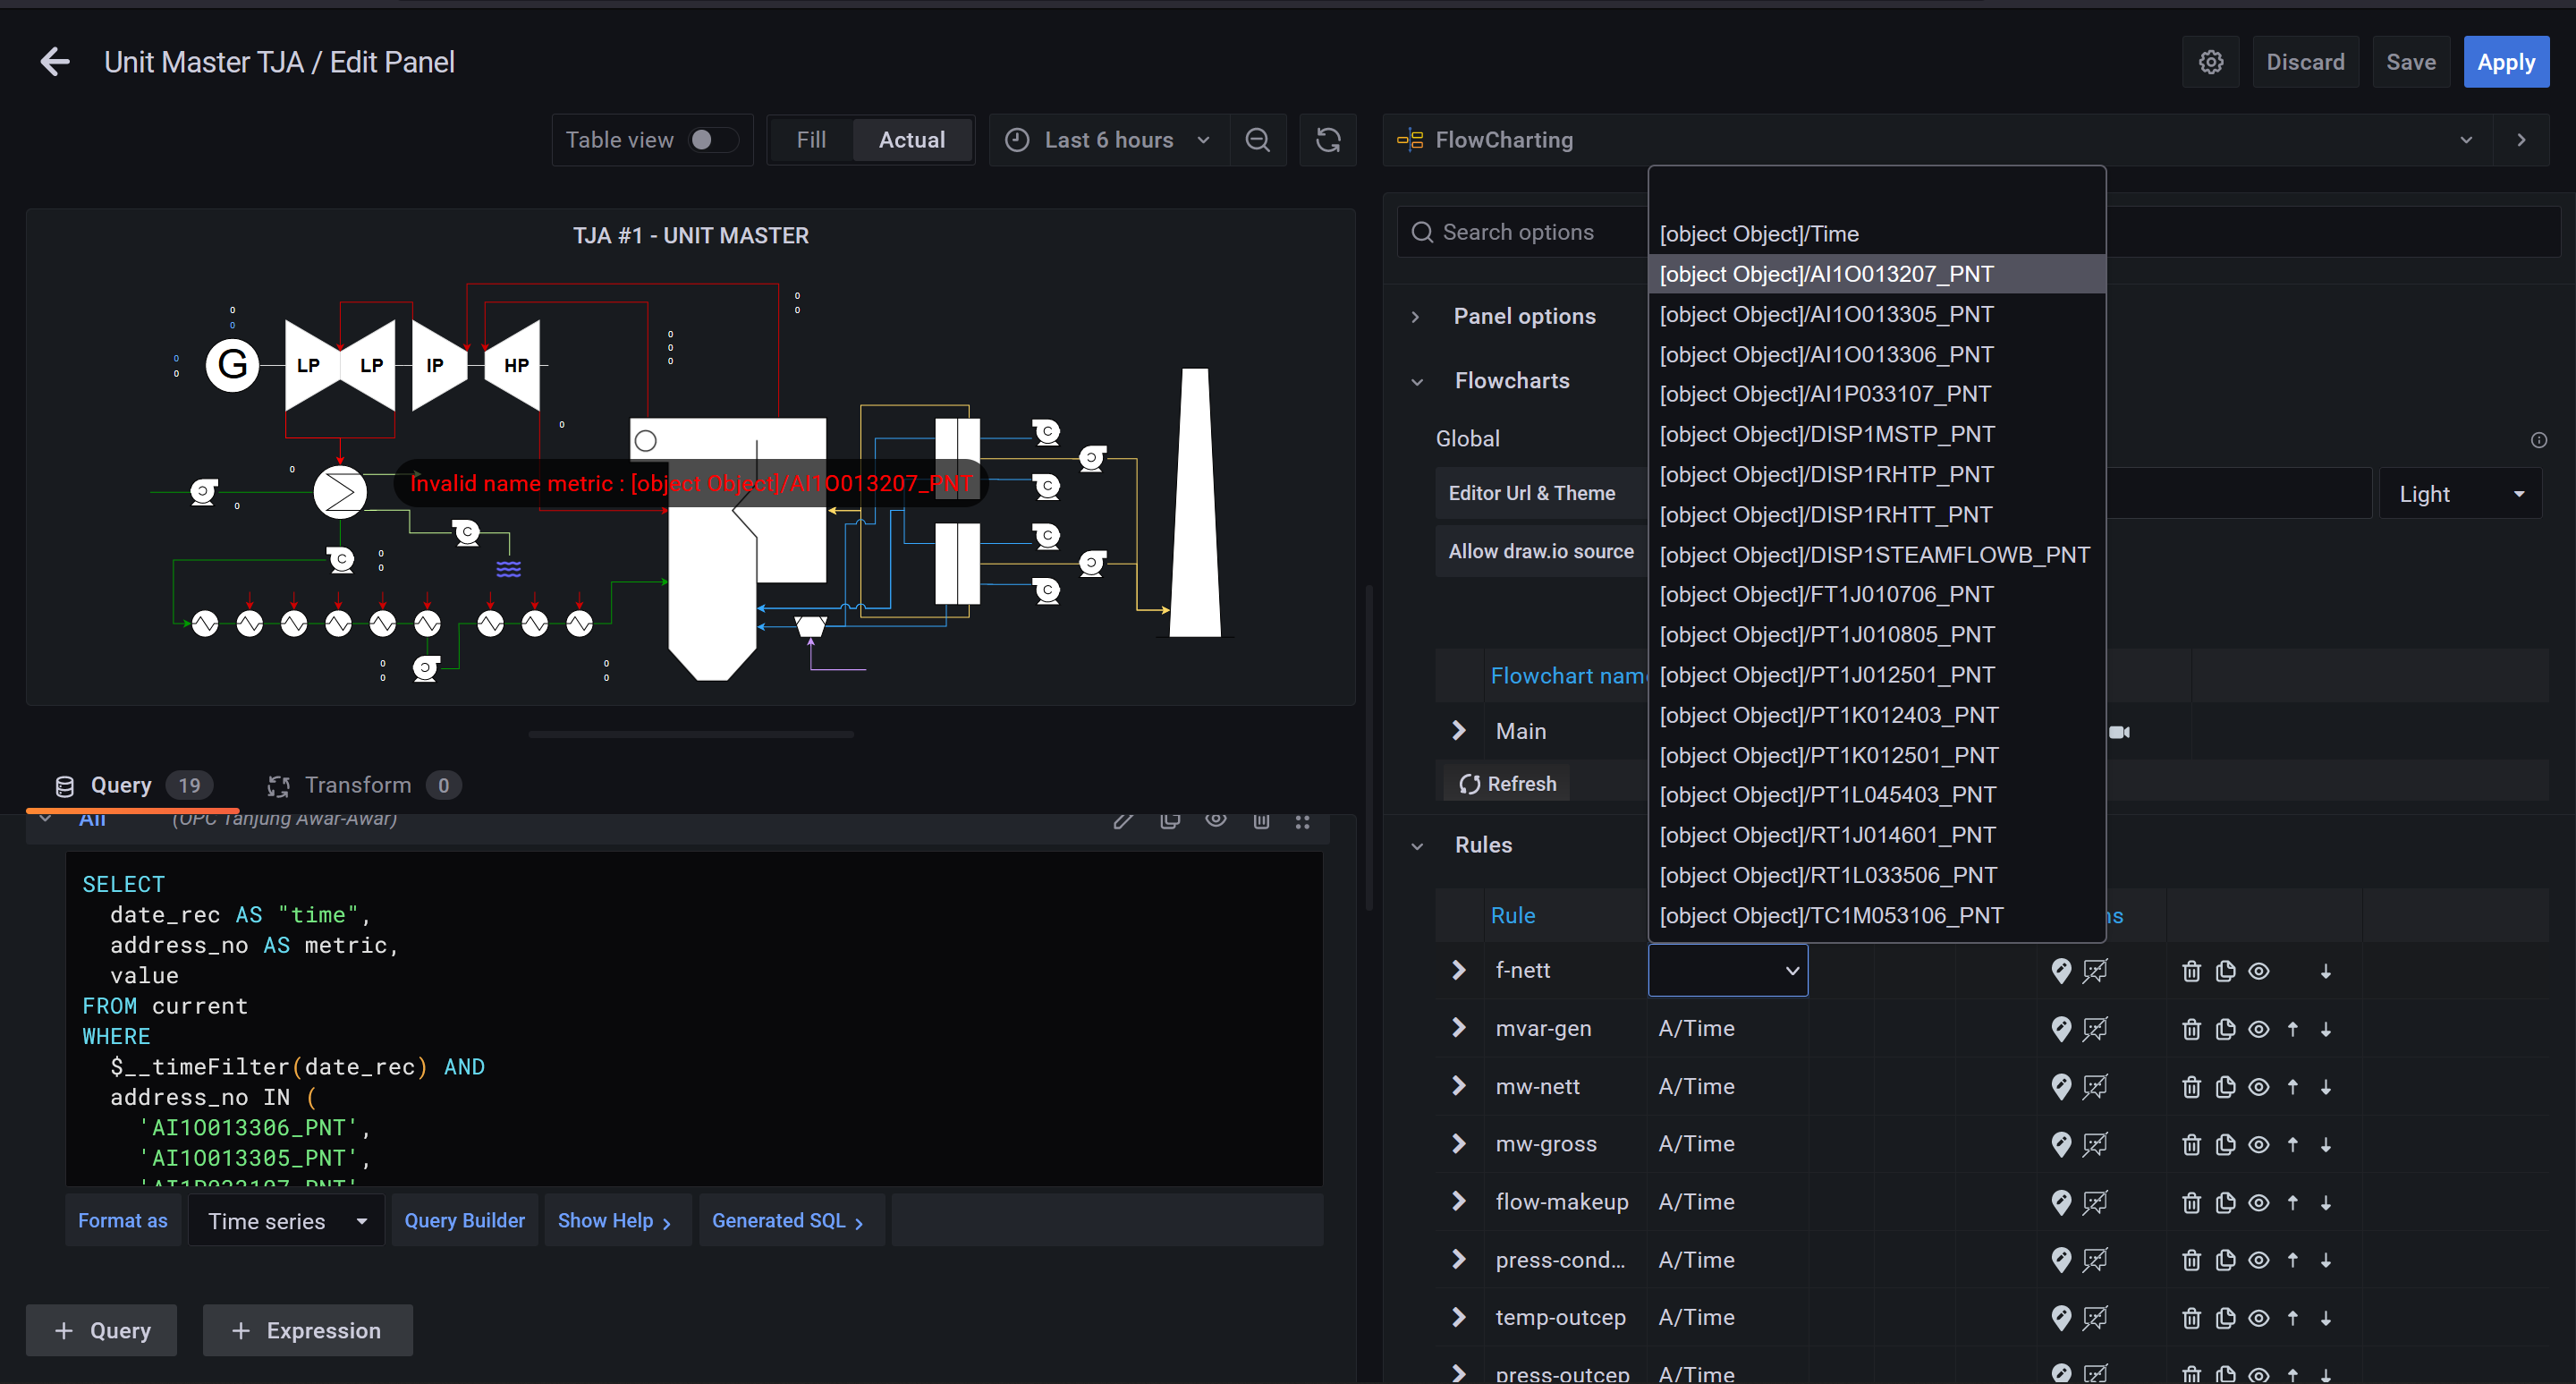
When a datasource query returns multiple fields, even though all fields are visible in the table view, you cannot select them from the "Apply to metrics" box. Even if you fill in the name manually, the value does not show up.
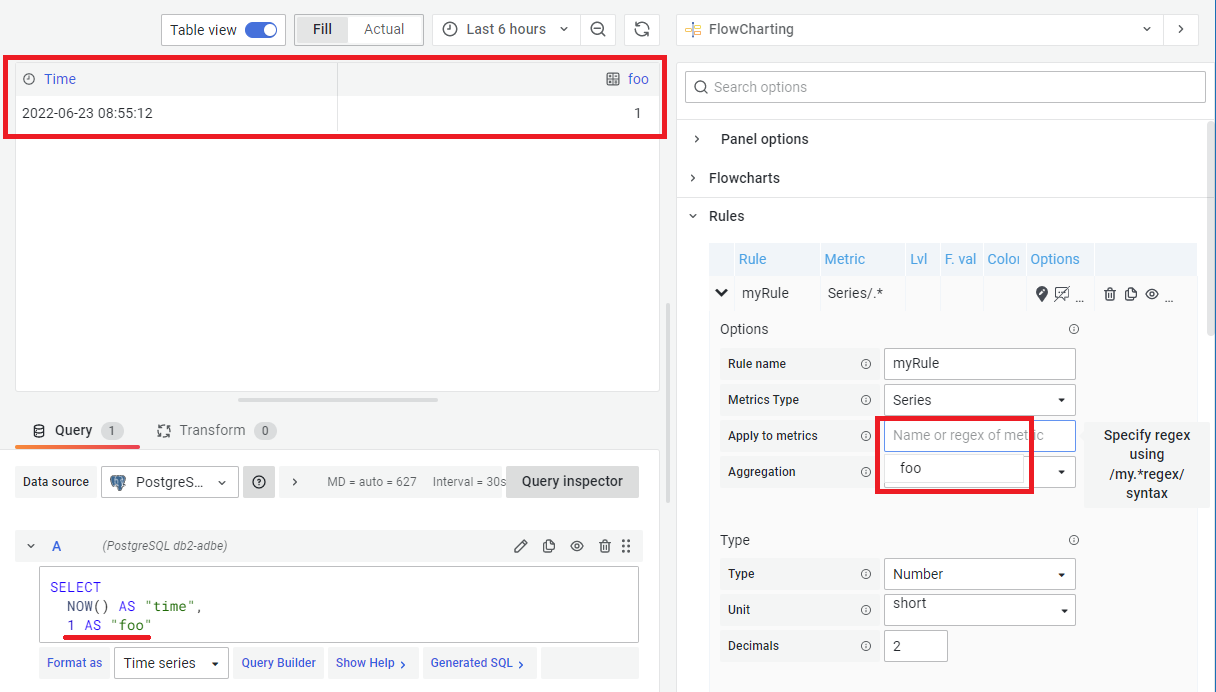
However if the query only returns 1 field, you can select them from the "Apply to metrics" box and the value does show up and can be used:
Grafana version: 8.5.6 Flowcharting version: 1.0.0d Browser: Chrome 102.0.5005.115 (Official Build) (64-bit) on Windows 10
this is somehow the same issue #347
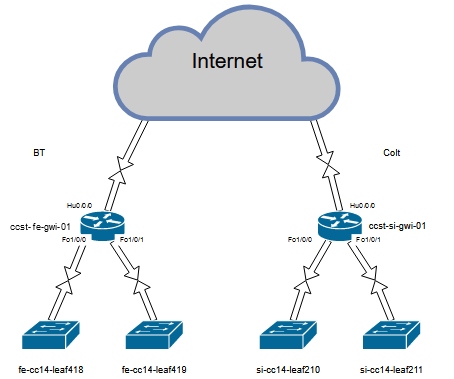
I'm trying to map multiple interface (mostly link usage) values from zabbix (table view)

to visualize the current usage:
@RedShift1 thanks for bringing this down to a simple example
it is postgres ?
No it is zabbix, but wen a single query returns multiple columns rule mapping is not possible
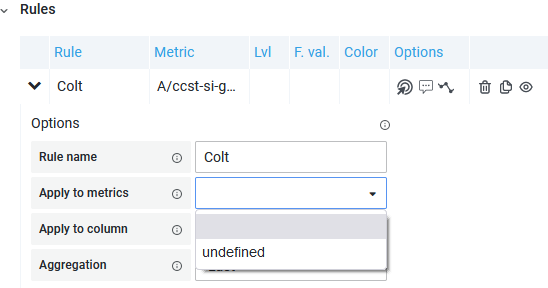
I have the same problem. I have a single query returning multiple columns (30 column), I can not select individual column in Metric column.
Grafana version: 9.1.0 Flowcharting version: 1.0.0d Database: Postgresql Browser: Firefox 103
I there i have the same issue on postgres
this works and i can select bar
select now() as time, 2 as bar
but this does not
select now() as time, 2 as bar, 3 as foo
Is there a way to get multiple queries to work?