sir could you please help me with the graph in the figure 2-9... how does it represent the various strata for the categories of the median income please sir..What does each axis represent and what is does it mean that most median income values are clustered around 2-5 but some go far beyond 6.please if you could help me sir..regards
sir could you please help me with the graph in the figure 2-9... how does it represent the various strata for the categories of the median income please sir..What does each axis represent and what is does it mean that most median income values are clustered around 2-5 but some go far beyond 6.please if you could help me sir..regards
Hi @Samrat666 ,
Thanks for your question, I should have added labels for these axes. The horizontal axis represents the income category: from 1.0 (lowest income) to 5.0 (highest income). More precisely, category 1 corresponds to incomes up to $15,000/year, then category 2 is between $15,000 and $30,000/year, category 3 is between $30,000 and $45,000/year, category is between $45,000 and $60,000/year, and category 5 is for all incomes above $60,000/year. The income category is defined like this:
housing["income_cat"] = pd.cut(housing["median_income"],
                               bins=[0., 1.5, 3.0, 4.5, 6., np.inf],
                               labels=[1, 2, 3, 4, 5])
Note that the median_income column represents tens of thousands of dollars, so for example 2.7 actually means $27,000/year.
The vertical axis represents the number of districts in each income category. For example, there are a bit over 7,000 districts where the income category is 3.0, and a bit more than 3,500 districts where the category is 4.0.
Hope this helps and you enjoy the book!
sir could you also explain this line with a bit detail :
for train_index,test_index in split.split(housing,housing["income_cat"]):
    strat_train_set = housing.loc[train_index]
    strat_test_set = housing.loc[test_index]
what is exactly happening in the looping statement for the split.split(--) what are the parameters of this split function and how are they passed here.
please sir sorry for the inconvenience
Hi @Samrat666 ,
Thanks for your question. A splitter generates multiple train/test splits of the same dataset. For example, try running this code, which uses a simple ShuffleSplit:
import numpy as np
from sklearn.model_selection import ShuffleSplit

split = ShuffleSplit(n_splits=3, test_size=0.2)

X = np.arange(10) + 10
y = np.random.randint(2, size=10)

split_index = 0
for train_index, test_index in split.split(X):
    split_index += 1
    print("--- Split", split_index)
    print("Train:", X[train_index], y[train_index])
    print("Test:", X[test_index], y[test_index])
    print()
It will output something like this (with different numbers since it randomly shuffles the data):
--- Split 1
--- Split 1
Train: [10 13 11 14 12 16 19 18] [0 1 1 0 0 1 1 1]
Test: [17 15] [0 1]

--- Split 2
Train: [18 17 10 14 12 15 16 13] [1 0 0 0 0 1 1 1]
Test: [11 19] [1 1]

--- Split 3
Train: [18 16 13 11 19 17 12 15] [1 1 1 1 1 0 0 1]
Test: [10 14] [0 0]
You can see that it generated 3 different train/test splits of the same data. This is useful in some cases when you want to train the model on random subsets of the data and evaluate it on the remaining instances, and you want to do this multiple times to get a better estimate of the model's performance.
In the notebook I just use n_splits=1 so it will only generate a single train/test split of the dataset (the for loop will only run for 1 iteration).
Moreover, in the notebook I use a StratifiedShuffleSplit, which is generally used to create train/test splits that preserve the ratio of instances from each class. For example, if the full dataset has 30% instances of class 1, and 50% of class 2 and 20% of class 3, then for each split the StratifiedShuffleSplit will do its best to cut the dataset into a training set and a test set which have roughly the same proportion of instances of each class. In order to be able to do that, we need to pass the labels to the split() method. Here's an example (it's the same code as above, but I replaced ShuffleSplit with StratifiedShuffleSplit and I pass the labels y to the split() method):
import numpy as np
from sklearn.model_selection import StratifiedShuffleSplit

split = StratifiedShuffleSplit(n_splits=3, test_size=0.2)

X = np.arange(10) + 10
y = np.random.randint(2, size=10)

split_index = 0
for train_index, test_index in split.split(X, y):
    split_index += 1
    print("--- Split", split_index)
    print("Train:", X[train_index], y[train_index])
    print("Test:", X[test_index], y[test_index])
    print()
If you run this code, you'll get something like this:
--- Split 1
Train: [18 19 15 11 17 13 16 12] [1 1 1 0 0 0 0 1]
Test: [10 14] [0 1]

--- Split 2
Train: [11 15 18 12 17 19 13 16] [0 1 1 1 0 1 0 0]
Test: [10 14] [0 1]

--- Split 3
Train: [10 14 16 19 13 15 17 12] [0 1 0 1 0 1 0 1]
Test: [18 11] [1 0]
Notice that the splits now contain exactly 50% instances of each class (you can see this by looking at the labels and noticing that there are the same number of 0s and 1s).
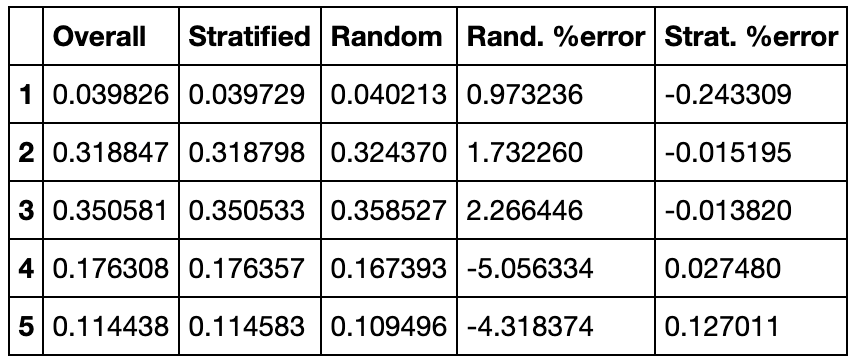
It's also possible to pass a categorical feature to the split() method instead of the labels y. The StratifiedShuffleSplit will then try to preserve the ratio of instances of each category in the train and test splits. This is what I did in the notebook, using the "income_cat" feature column. For example, the overall proportion of districts with income_cat=3 is 0.350581, and the StratifiedShuffleSplit managed to create a test set containing a ration of income_cat=3 of 0.350533, which is super close. In contrast, when we do a completely random split, we get a proportion of income_cat=3 of 0.358527, which is off by about 2.3%.
I hope this is all clear and you're enjoying the book.
cmap=plt.cm.gray, cmap=mpl.cm.binary and cmap=plt.get_cmap("gray")
i just wanted to ask that what is the difference between all these three and the other functions. Please help me out sir I searched a lot on the internet over this issue but could not be resolved. My issue is that :-- 1>Are these three almost same function or are different with different set of color maps? 2>Are the color maps same but perform differently when operated on these three? 3>If not then are these functions some data or dataset specific if not then what are the use of these three statements... You can understand my breadth of confusion sir please help...