bezier-chart
 bezier-chart copied to clipboard
A beautiful bezier line chart widget for flutter that is highly interactive and configurable.

Please see the screenshot below:  As you can see, the first data point has value of 44.5, which is exactly the middle between 44 and 45, hence AB should...
 Like the image above. If you know a way of doing this without implementations do say.
This is a simple addition, allowing the user to enable animation on the line drawing. 
data like[value: 12346973724.0, xAxis: 2019-09-08 00:00:00.000, value: 12346973724.0, xAxis: 2019-09-09 00:00:00.000, value: 12346973724.0] so pity ,can anyone help me 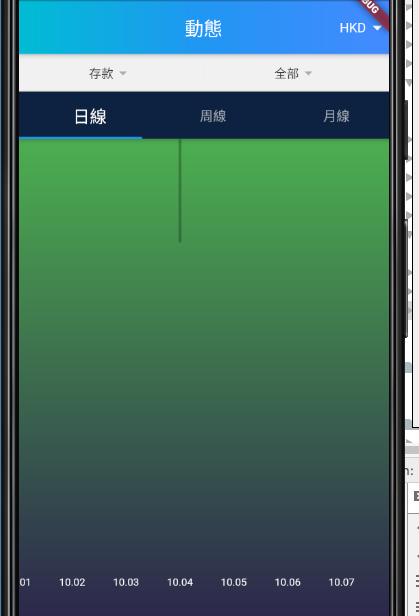
In case `displayYAxis = true` and the user scrolls to the leftmost chart side, the bubble indicator gets cut off on the left side. See the screenshot enclosed.  In...
Hey there, I was just wondering what the possibility of allowing for a second Y-axis on the right side of the chart which uses a different scale might be and...
Can you add fill gradient. 