Adrian Schmutzler
Adrian Schmutzler

I use the area-step chart to show histograms. (This works quite nicely if you take care to pad all data series with one zero on each side, at least it's...
I'm trying to set up a textoverlap to separate the labels on a Gauge chart (I hope that's possible at all). 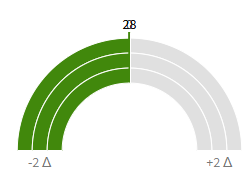 However, since the Gauge chart has null for...
I'm trying to implement a third-party mechanism for text overlap reduction in my code. Currently, I'm just using onrendered to hook my function, which will have the label jump into...
When using animations (e.g. blinking via `@keyframes`), Chromium will blur the chart which is particularly visible for text. An easy solution is to enforce integer width/height. (inspired by [1]) Thus,...
If I set min/max on gauge ("multi" mode*), and data goes beyond the min/max values set before, the scale is updated accordingly. I'm looking for a way that min/max are...
I'm trying to build a gauge chart with threshold values displayed inside the chart. Therefore, it would be helpful if one could have lines or regions defined for the gauge...
Version used: GitTfs-0.32.0.zip Visual Studio 2019 installed I've just started with git-tfs, and (after some initial try-and-error) was able to get a working git repo with `git tfs clone https://dev.azure.com/xxx...
So far, filtering rules are evaluated based on their order in the configuration (or uci config for OpenWrt). This is rather inconvenient when using scripts to alter these configurations (particularly...
alfred uses properties from network interfaces, like the MAC address. Since these might be altered by /etc/config/network, alfred should be restarted on change. --- @simonwunderlich @ecsv I also think this...