Inspect Traffic via Dashboard
proxy is working ok ,iwant to use the dashboard,i give the commnad in windows 10:"proxy --enable-dashboard,but not open localhost:889/dashboard;i give permissions to localhost in my configuration of proxy
installed on raspbian buster,but i can´t get traffic information with /dashboard,please help
@spereg53 Dashboard inspect traffic is known to work fine in Mac environment. Sorry, but I have never tested it in Windows. Also, note that, dashboard is a WIP, so it might not always work as expected. Specially, because chrome dependency keeps upgrading, chances are chrome dev tools integration (UI only) might be broken.
You can simply enable inspection and then point your chrome dev tools to proxy.py web socket endpoint.
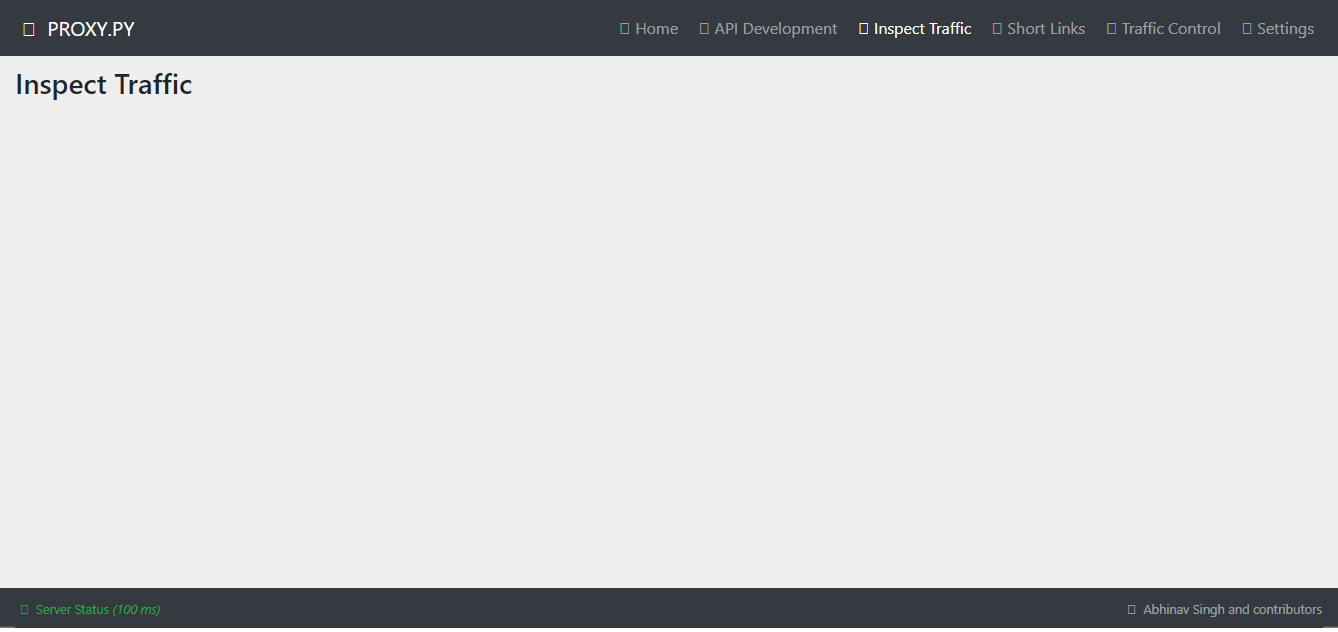
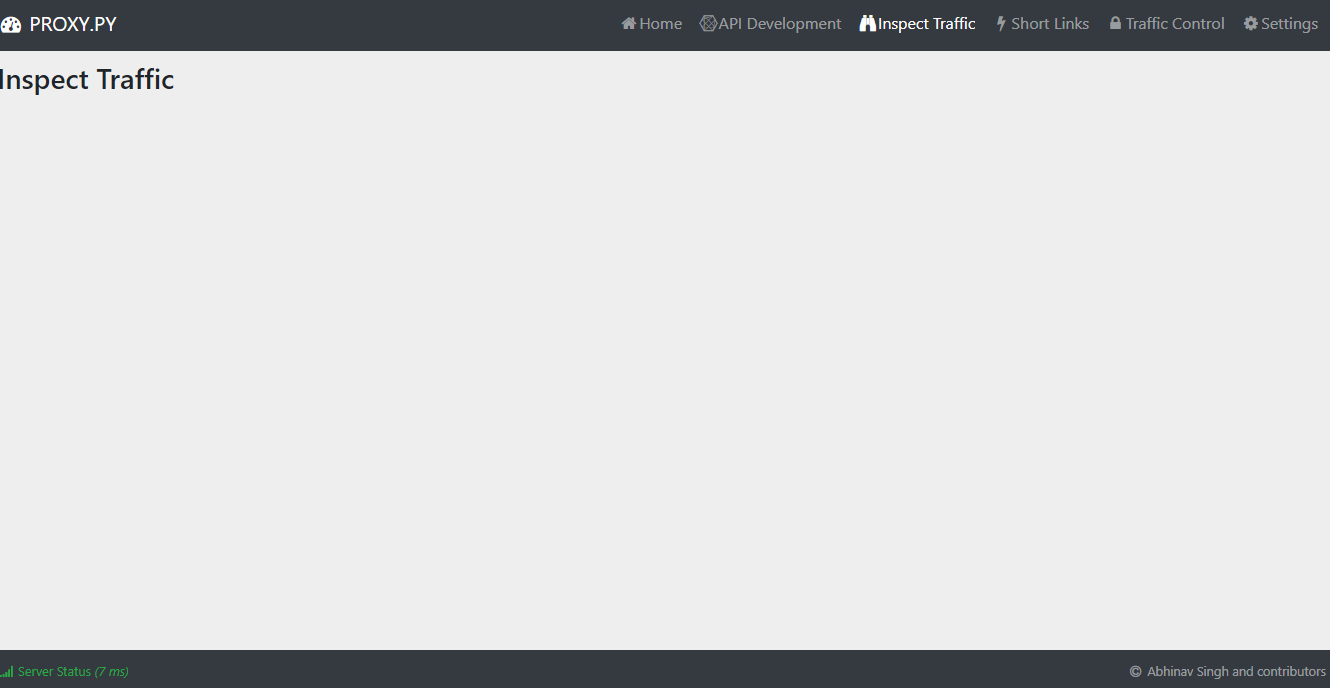
image of dev tools of chrome: [image: image.png]
ING.SERGIO M.PEREZ GORDILLO CALLE DE CHAMULA #21 COL.LA LOMITA;C.P.29060 TUXTLA GTZ.CHIAPAS,MEXICO TEL:019612640373 y 019611214526 CELULAR:9612015537 @.*** @.***
El sáb, 6 ago 2022 a la(s) 22:39, Abhinav Singh @.***) escribió:
@spereg53 https://github.com/spereg53 Dashboard inspect traffic is known to work fine in Mac environment. Sorry, but I have never tested it in Windows. Also, note that, dashboard is a WIP, so it might not always work as expected. Specially, because chrome dependency keeps upgrading, chances are chrome dev tools integration (UI only) might be broken.
You can simply enable inspection and then point your chrome dev tools to proxy.py web socket endpoint.
— Reply to this email directly, view it on GitHub https://github.com/abhinavsingh/proxy.py/issues/1245#issuecomment-1207324519, or unsubscribe https://github.com/notifications/unsubscribe-auth/ABKVABKVA7K6BDS4WFBGEJ3VX4VYBANCNFSM55ZA63SA . You are receiving this because you were mentioned.Message ID: @.***>