ggtree
 ggtree copied to clipboard
how to solve x-axis line-end?
code:
#! /usr/bin/env Rscript
pacman::p_load(treeio,ggtree,data.table,ggprism)
tree <- read.tree(text="(((CCAN:86.5,SLYC:86.5):48.1,(((((((CPAP:74.3,ATHA:74.3):15.1,(GRAI:28.9,HSYR:28.9):60.5):6.9,((CSIN:2.9,CRET:2.9):49.9,AALT:52.8):43.5):5.7,(RCOM:76.6,PTRI:76.6):25.4):9.5,((MDOM:38.4,PPER:38.4):62.3,(GMAX:92.5,CSAT:92.5):8.2):10.8):4.6,(PGRA:82,EGRA:82):34.1):8.5,VVIN:124.6):10):25,OSAT:159.6);")
inode <- subset(fortify(tree),!isTip) %>% as.data.table() %>% .[,node]
data <- data.table(a = tree$edge  %>% as.data.table() ,b=as.data.table(tree$edge.length)) %>%
	setnames(c('V1','V2','V3')) %>%
	mutate(V0=paste0(V1,"-",V2),.before=1) %>%
	filter(V2 %in% inode)

alen <- tree$edge.length %>% sort(decreasing = T) %>% .[1]
times <- NULL
for(n in inode){
	if(is.na(ancestor(tree,n)[1])){
		times <- data.table(node=n,time=sprintf("%.1f",alen))
	}else{
		x <- c(ancestor(tree,n) %>% sort(),n)
		blen <- 0
		for(i in 1:(length(x)-1)){
 			range <- paste0(x[i],'-',x[i+1])
 			blen0 <- data %>% filter(V0 == range) %>% .[,V3]
    		blen <- blen + blen0
		}
		times0 <- data.table(node=n,time=sprintf("%.1f",alen-blen))
		times <- rbind(times,times0)
	}
}

min <- ceiling(alen)*-1
pp <- ggtree(tree,mrsd='00-01-01')  + geom_tiplab()
p <- pp  %<+% times+
	geom_nodelab(aes(label=time),hjust=0,vjust=0.5)+
	theme_tree2(plot.margin=margin(16, 30, 16, 30))+
	scale_x_continuous(limits=c(min,10),breaks=seq(min,0,10),labels=abs,expand=c(0,0),guide = "prism_minor")+
	labs(caption="Divergence time (million years ago)")
p
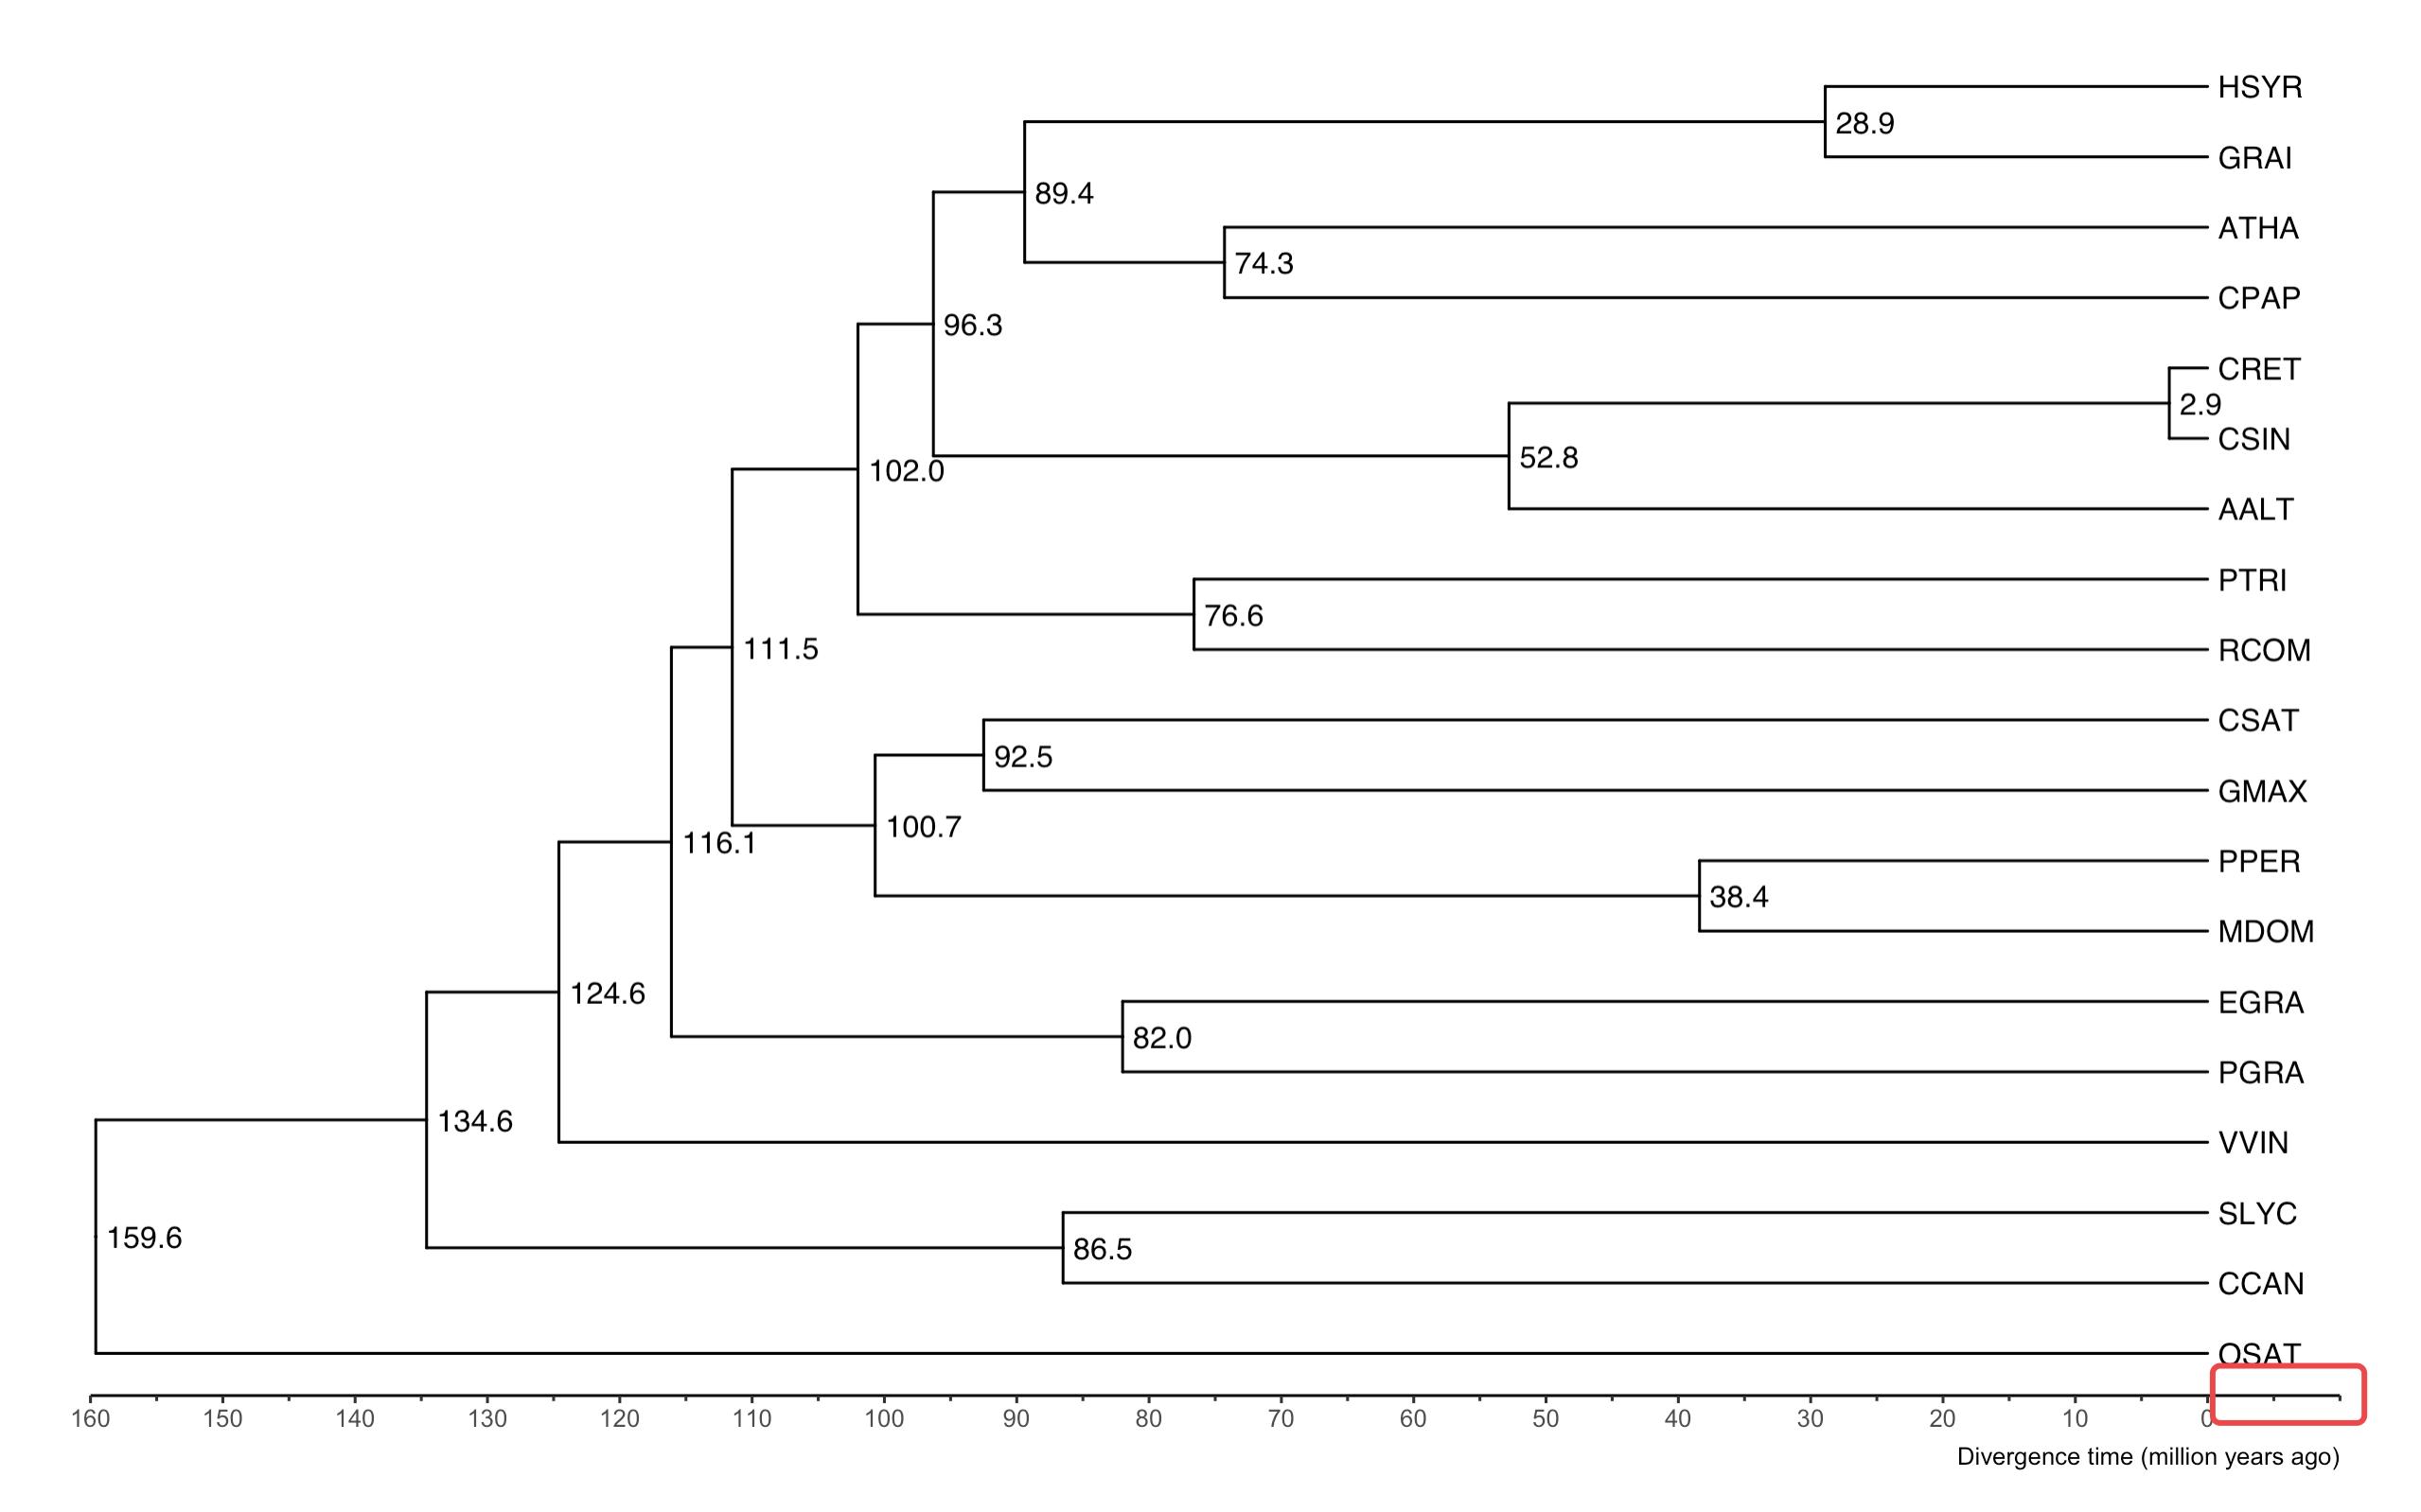
I wanna delete x-axis right end line ,how to set ?
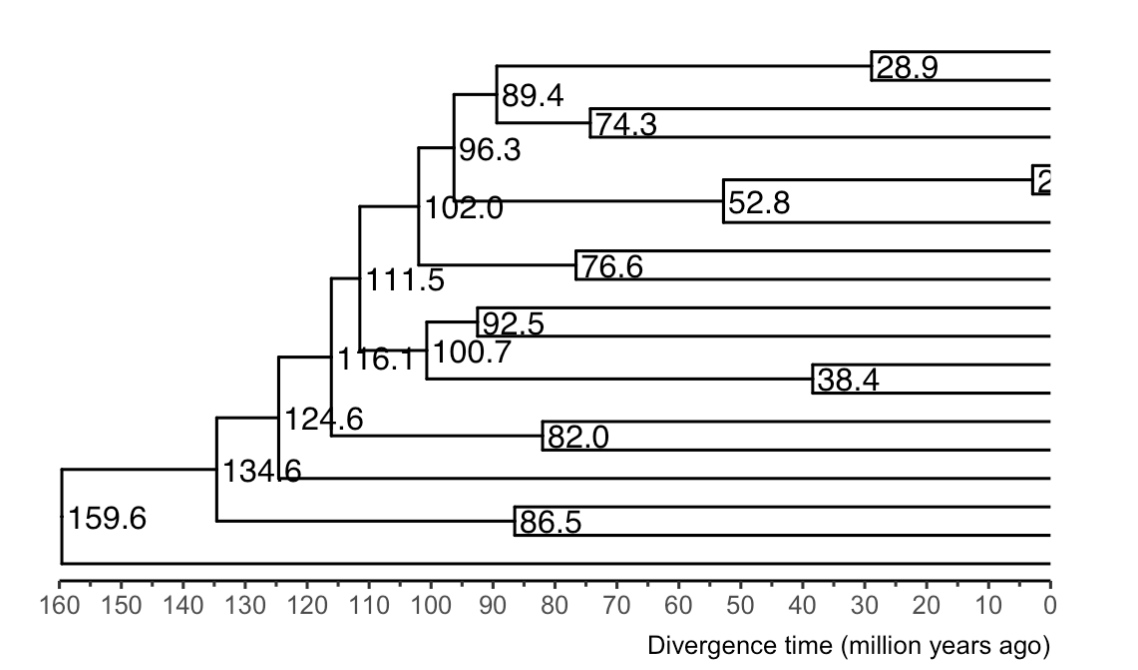
You set limits=c(min,10) in scale_x_continuous that sets the upper limit to 10. I think you meant to set limits=c(min,0) that sets the upper limit to 0.
You set
limits=c(min,10)inscale_x_continuousthat sets the upper limit to 10. I think you meant to setlimits=c(min,0)that sets the upper limit to 0.
when set limits=c(min,0), unable to show tiplabel
when set
limits=c(min,0), unable to show tiplabel
adding as_ylab = TRUE in geom_tiplab since the layout is rectangular and the geom is text.

Ok, This feature will be optimized. Now you can put theme_tree2 to the front of geom_tiplab and remove plot.margin. Or you can use another method to solve the problem, you can refer to Tip label truncated (Figure A.1C).