ggtree
 ggtree copied to clipboard
Published
20 hours ago •
 YuLab-SMU
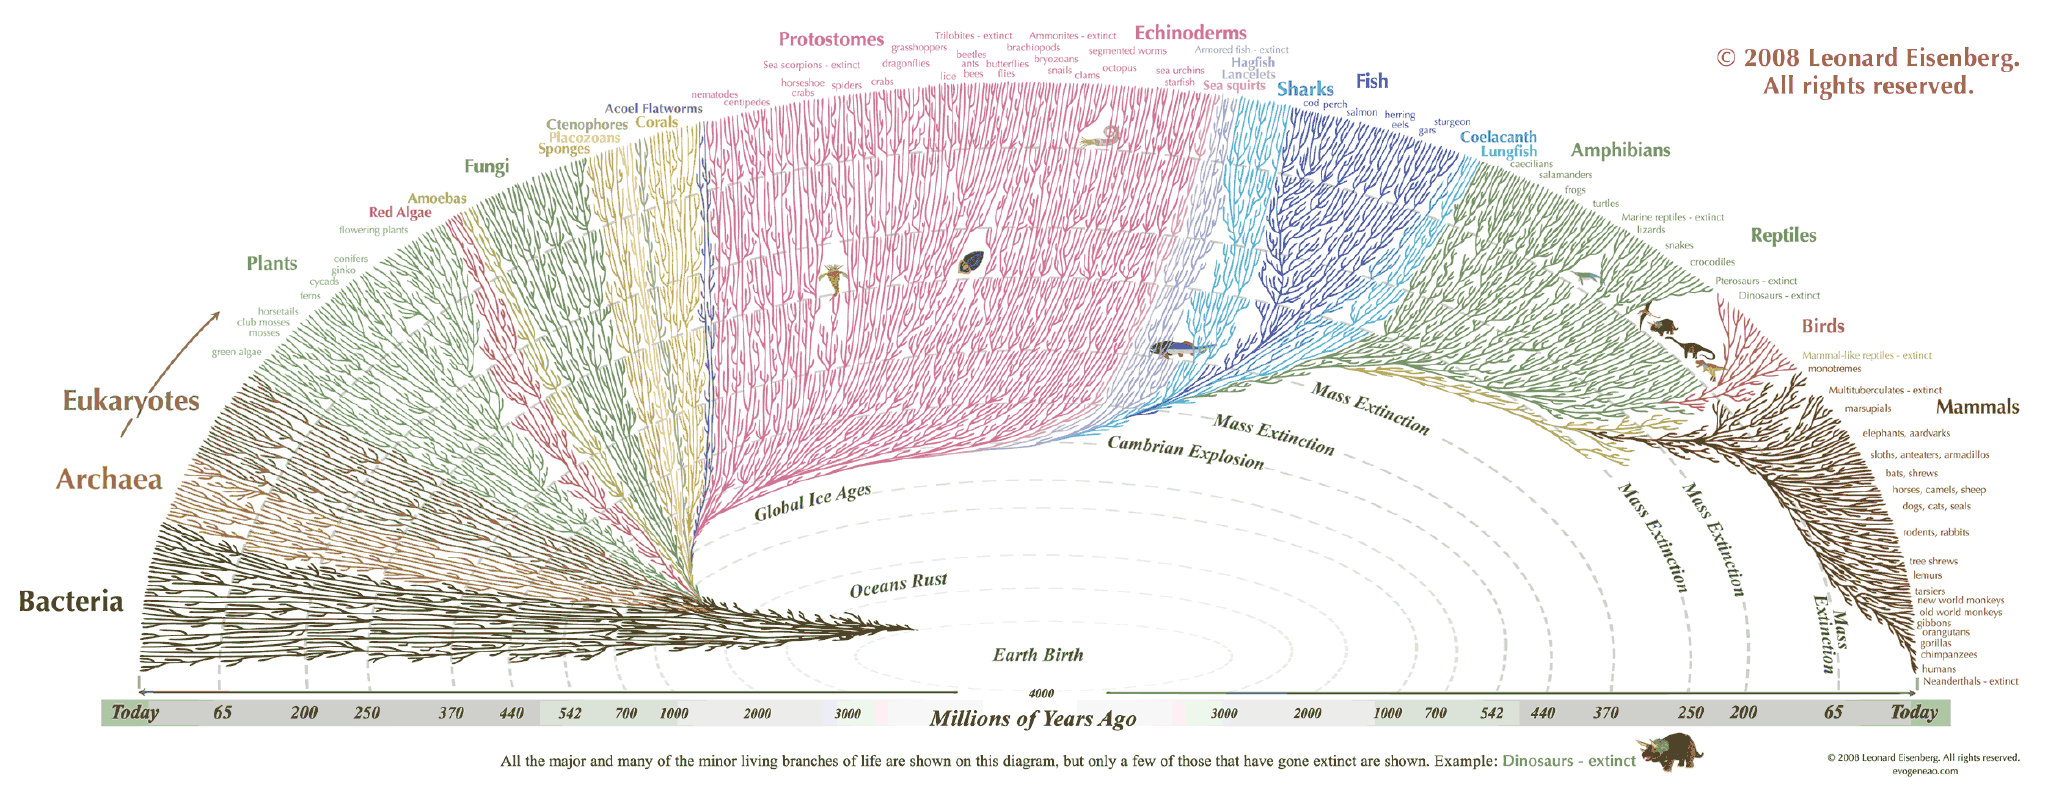
Using contour line to draw the time tree
trafficstars
Hello Uncle Yu,
Thank you and your team for bringing us such a powerful ggtree package. I'd like to ask if ggtree can achieve the following style of visualization, which used contour line to show the divergent time. I thought it was very suitable for trees with many species.
Thank you.
grid line?
ggtree(x) + theme(panel.grid.major=element_line()) + layout_circular()

If you want more control of over the contours you can adjust the x scale (from @GuangchuangYu's example) :
ggtree(x) + theme(panel.grid.major=element_line()) + layout_circular() + scale_x_continuous(breaks=c(1, 2, 3))
You could also try using annotate to add the lines
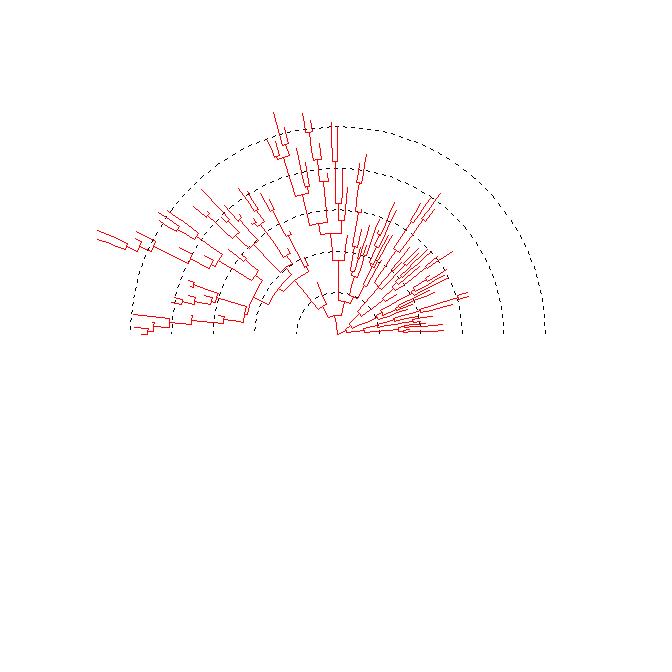
set.seed(1)
tree <- rtree(100)

p <- ggtree(tree, colour='red') +  layout_fan(angle = 180)

p + annotate(geom = 'line', x = sapply(1:5, rep, 3), y = rep(c(0, 100, NA), 5), linetype = 'dashed')

And to put the lines behind the tree:
p$layers <- c( annotate(geom = 'line', x = sapply(1:5, rep, 3), y = rep(c(0, 100, NA), 5), linetype = 'dashed'), p$layers)
p