ggtree
 ggtree copied to clipboard
Composite plots to circular layout
Dear Prof Yu, I see a wonderful example of the ggtree data in the 7.5 sector. https://yulab-smu.github.io/treedata-book/chapter7.html#gheatmap-ggnewscale
library(ggplot2) library(ggtree)
set.seed(2019-10-31) tr <- rtree(10)
d1 <- data.frame( label = c(tr$tip.label[sample(5, 5)], "A"), value = sample(1:6, 6))
d2 <- data.frame( label = rep(tr$tip.label, 5), category = rep(LETTERS[1:5], each=10), value = rnorm(50, 0, 3))
g <- ggtree(tr) + geom_tiplab(align=TRUE)
p1 <- ggplot(d1, aes(label, value)) + geom_col(aes(fill=label)) + coord_flip() + theme_tree2() + theme(legend.position='none')
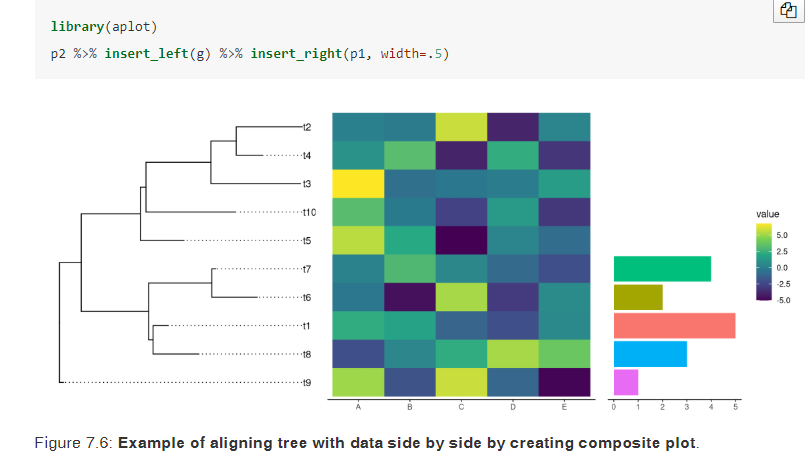
p2 <- ggplot(d2, aes(x=category, y=label)) + geom_tile(aes(fill=value)) + scale_fill_viridis_c() + theme_tree2()
library(aplot) p2 %>% insert_left(g) %>% insert_right(p1, width=.5)
I wonder if it is possible to create a circular layout of this data
so that ggtree can really reporduce a figure like bellow.
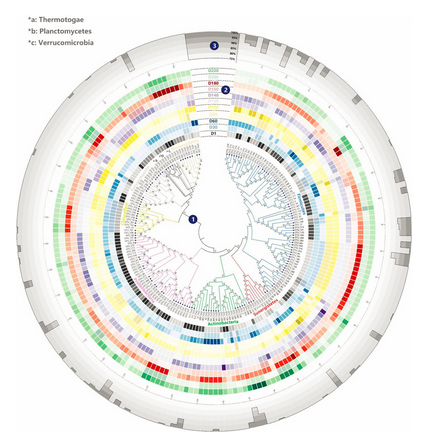
Yes, You can reporduce the figure using
ggtreeExtra
Awesome! I try the code in ggtreeExtra, the starshape seem not to work.
Error in starGrob(x = coords$x, y = coords$y, gp = gpar(fill = alpha(coords$fill, : the starshape should be one of 1 to 12 ! Warning message: Removed 229 rows containing missing values (geom_star).
The version of ggstar in README is development. You can update the vesion of ggstar from github, or you can use scale_starshape_manual to set 1~12 values.
The version of ggstar in README is development. You can update the vesion of
ggstarfromgithub, or you can usescale_starshape_manualto set1~12values.
Great! Problem solved out! The ggstar is also great! The pch is limit in to several groups. You guys are asesome!