ggtree
 ggtree copied to clipboard
missing factors in geom_barh with facet_plot(?)
Hi,
I've been trying to plot a bar chart with community composition together with a hierarchical clustering dendrogram, and while I was able to plot it, there are always some of the factors that while they still appear in the legend, they are missing from the bar chart. I found out first trying to plot 10 factors but it happens even with only 5. Files for reproducible example: example_files.zip
library(ggtree)
library(tidyverse)
library(ggstance)
dist <- read.csv("dist.csv", header = TRUE, row.names = 1)
dist1 <- as.dist(dist)
hc <- hclust(dist1)
den <- as.dendrogram(hc)
p <- ggtree(den)
# load table with data for bar chart
mytable <- read.csv("mytable.csv", header = T, row.names = 1)
#put together
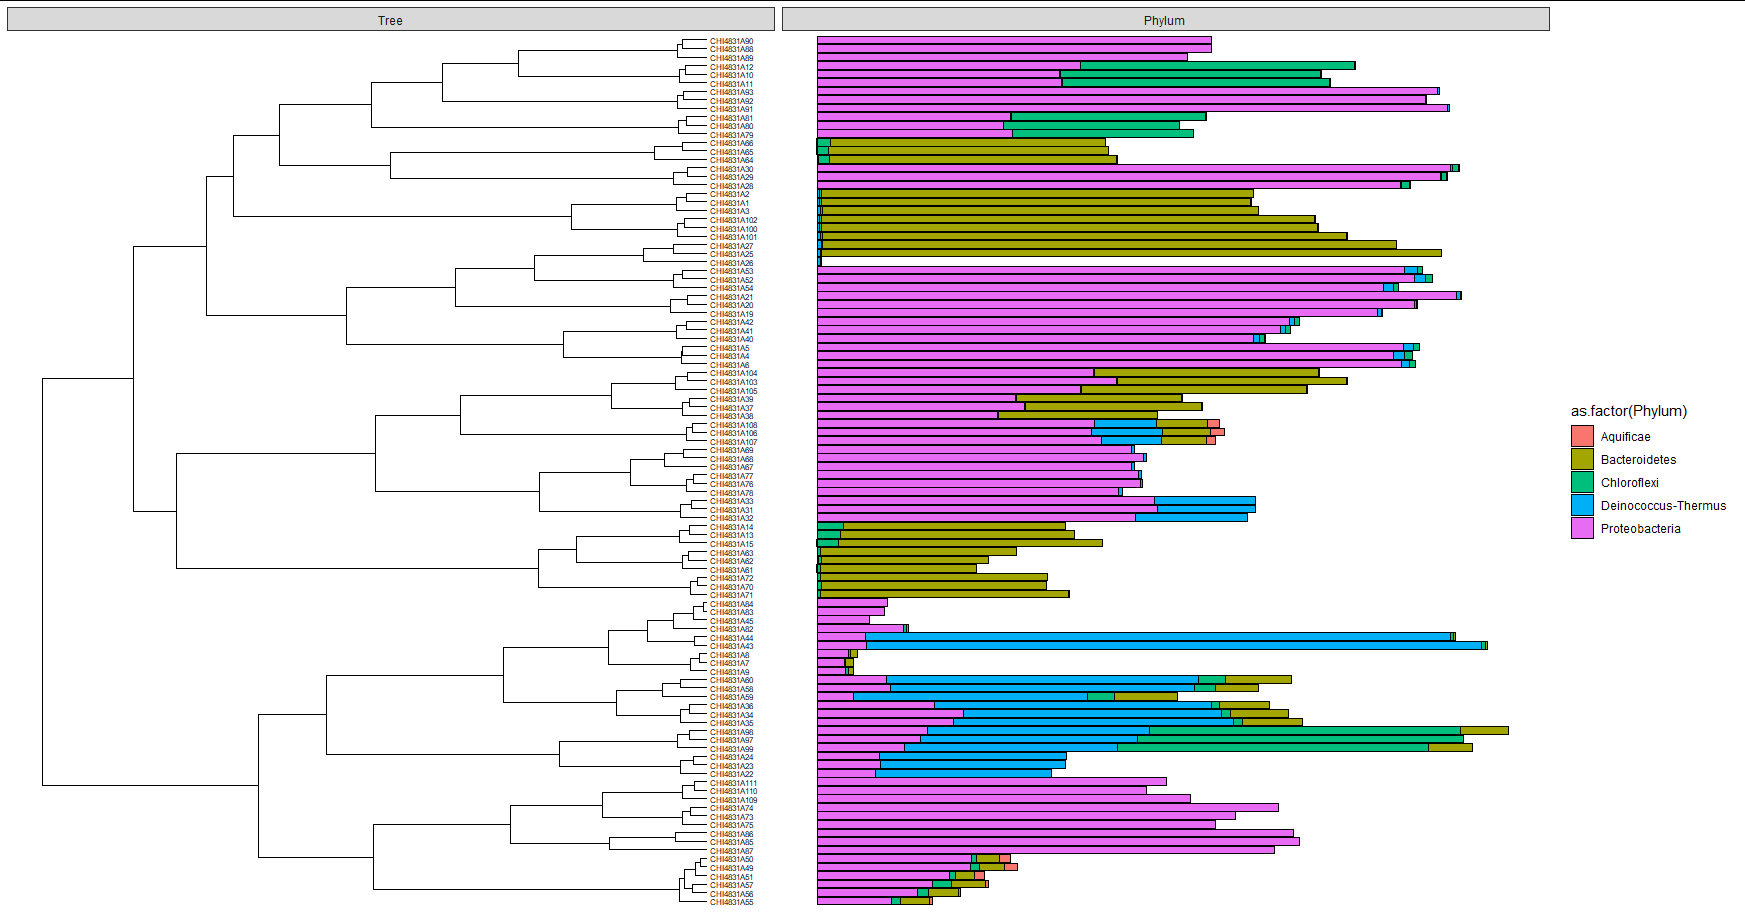
facet_plot(p, data = mytable, geom = geom_barh, panel = "Phylum", colour = "black",
mapping = aes(fill = as.factor(Phylum),x=Abundance), stat = "identity") +
geom_tiplab(size = 2) + xlim(0, 0.38)
This is the output, which in this simplified example, misses all Aquificae (should be >50% in some samples):
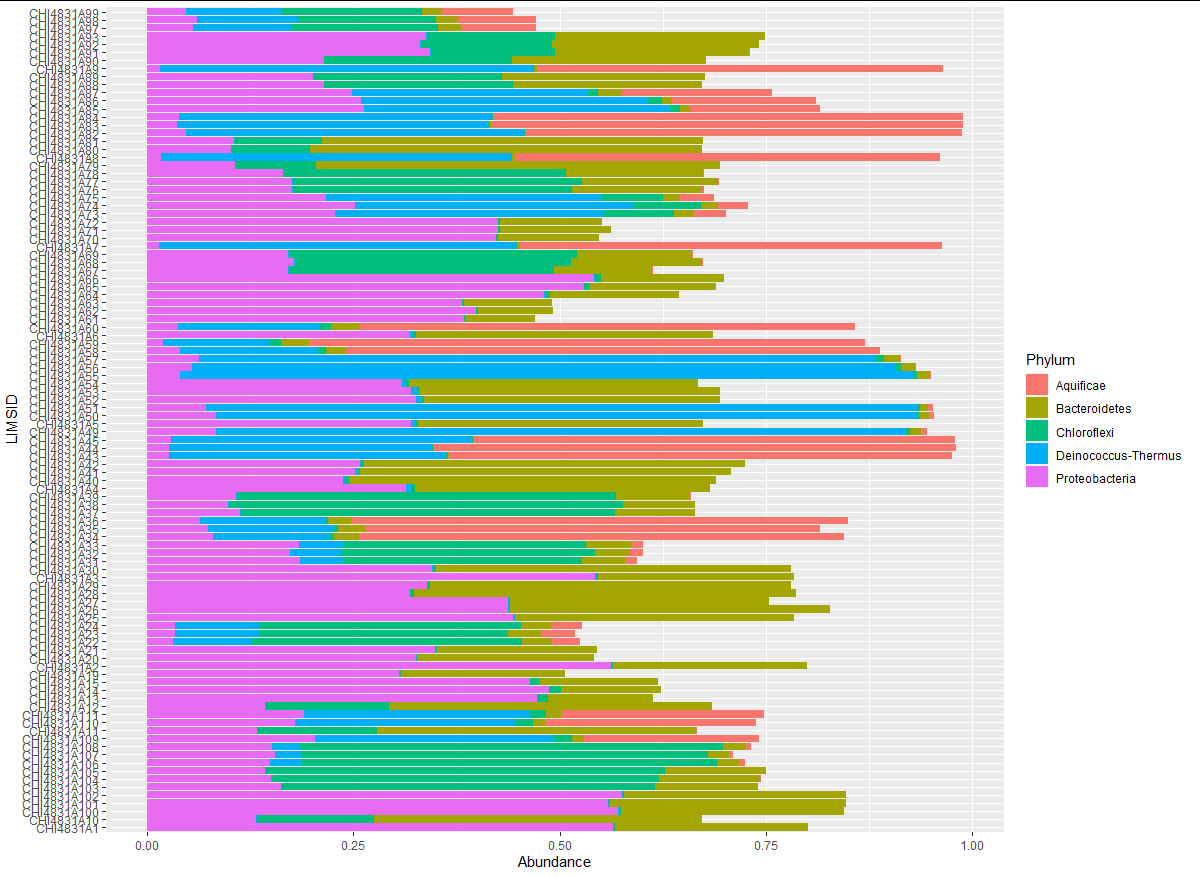
To be sure it wasn't a problem with mytable, I run it with ggplot as normal geom_bar and as geom_barh from ggstance (only showing the latter here):
ggplot(mytable, aes(y=LIMSID, x = Abundance)) +
  geom_barh(aes(fill=Phylum), position = "stack", stat = "identity")
and as you can see there are obvious differences:
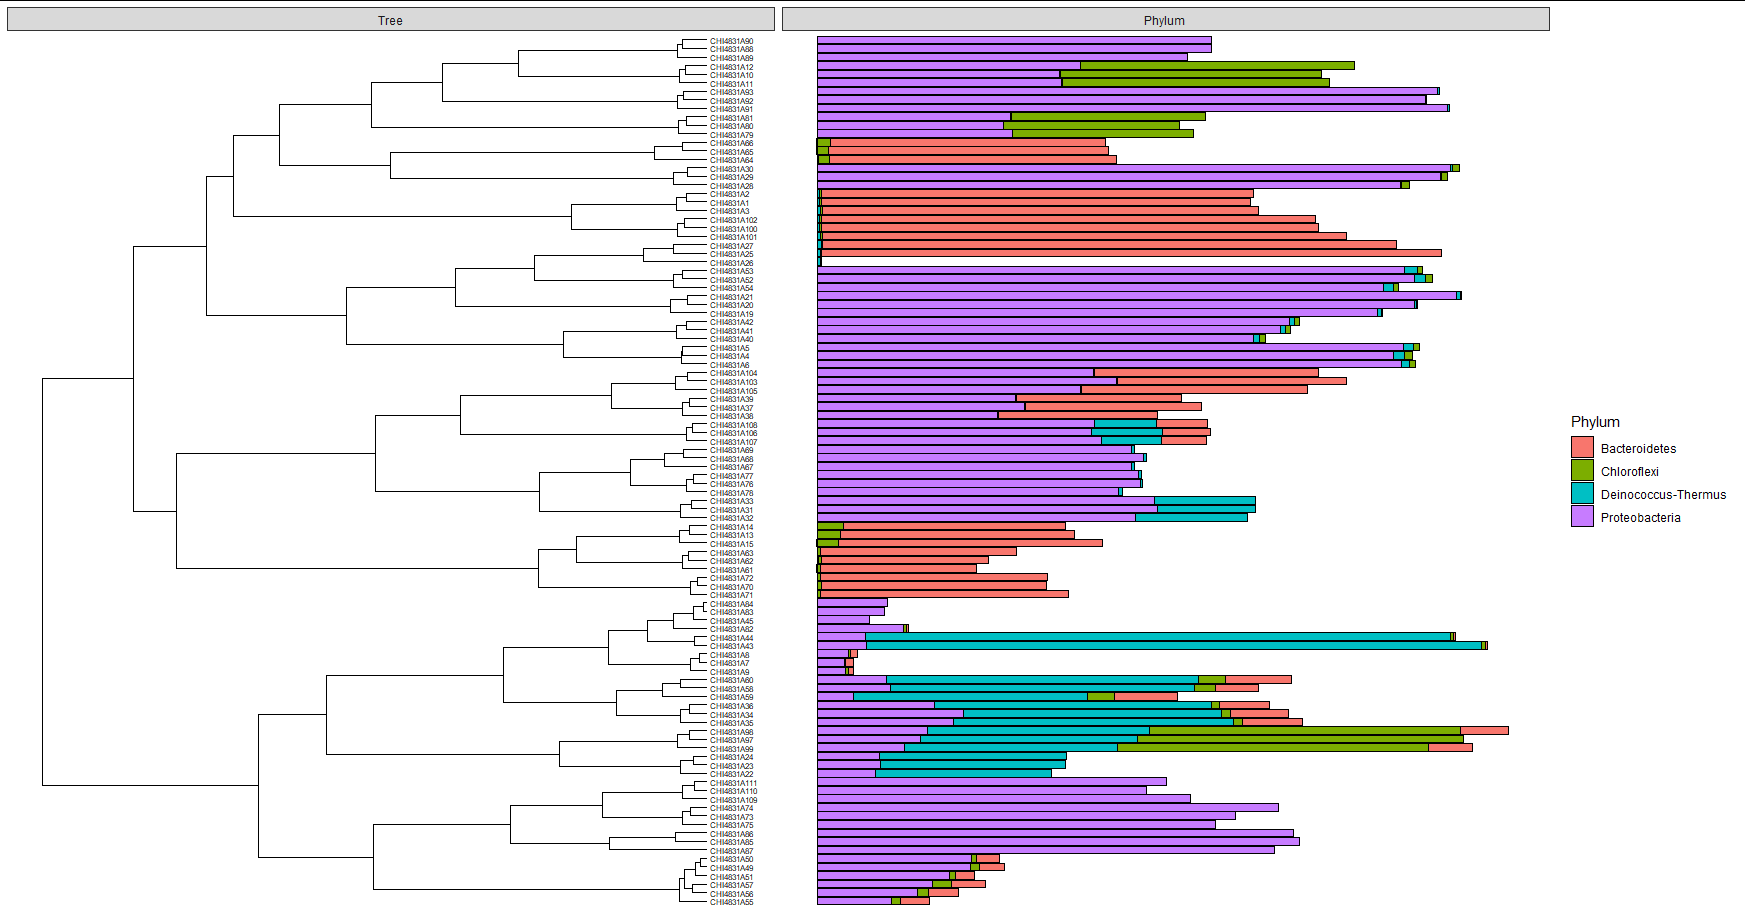
I did further testing by removing one of the factors in mytable$Phylum:
mytable2 <- mytable[mytable$Phylum != "Aquificae", ]
facet_plot(p, data = mytable2, geom = geom_barh, panel = "Phylum", colour = "black",
           mapping = aes(fill = as.factor(Phylum),x=Abundance), stat = "identity") +
  geom_tiplab(size = 2) + xlim(0, 0.38)
And now it shows 4 categories without issue:
 or it seems...

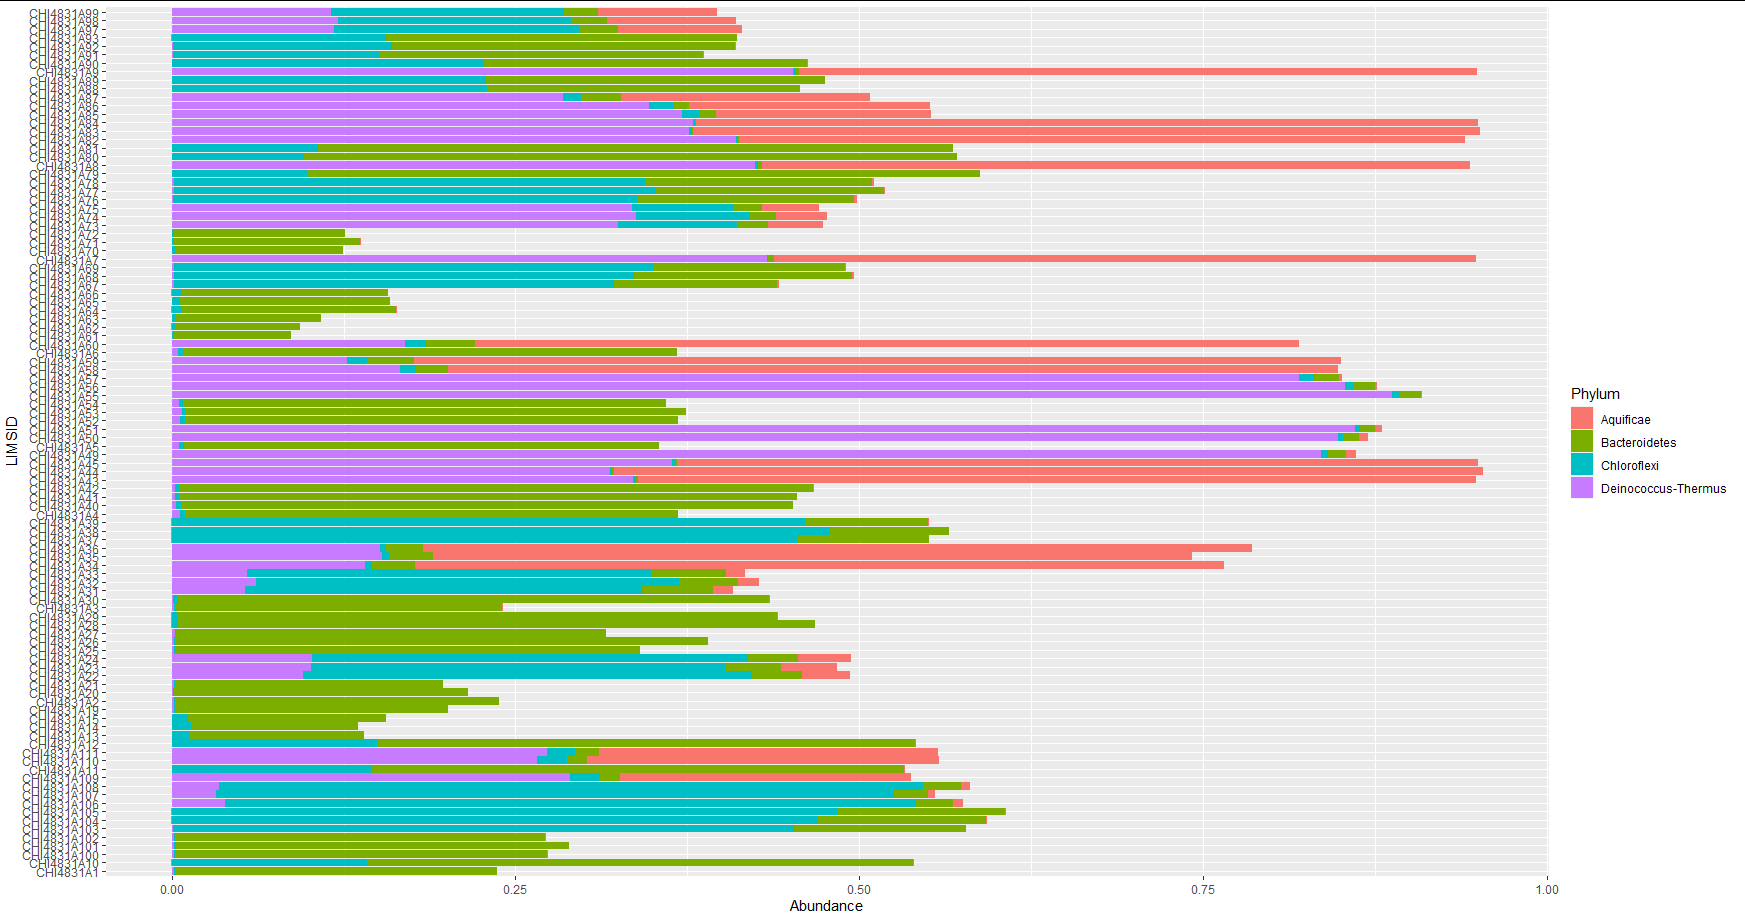
If I remove a different one, the offending "Aquificae" only shows up in a few samples where is a very minor component:
mytable3 <- mytable[mytable$Phylum != "Proteobacteria", ]
facet_plot(p, data = mytable2, geom = geom_barh, panel = "Phylum", colour = "black",
           mapping = aes(fill = Phylum, x=Abundance), stat = "identity") +
I've run this on R3.6.3 and both ggtree versions 2.0.4 (from Bioconductor) and 2.3.0 (from Github).
I also usually get the following message, which I wouldn't be surprised it would be related, but it doesn't matter if I remove zeroes from my table, the rows removed barely change:
Warning messages:
1: Removed 53 rows containing missing values (position_stack).
2: Removed 82 rows containing missing values (geom_barh).
I've also tried to ordered the data on my table based on the order from p$data$label or the order of the leaves from the hclust output, but all the same.
Can anyone reproduce this? Is there anything obvious I'm missing?
Thank you in advance, Xabi
Since you used xlim. The range of x is 0 ~ 0.38 in your example, the x of geom_barh will be removed. To solve the problem, you should not use xlim. And you can use geom_blank to show the tiplabels. PS: you can use geom_bar of ggplot2 (new version) instead of geom_barh of ggstance by adding orientation="y".
library(ggtree)
library(tidyverse)

dist <- read.csv("dist.csv", header = TRUE, row.names = 1)
dist1 <- as.dist(dist)
hc <- hclust(dist1)
den <- as.dendrogram(hc)
######## geom_blank##############
p <- ggtree(den) + geom_blank(aes(x=0.42))

# load table with data for bar chart
mytable <- read.csv("mytable.csv", header = T, row.names = 1)

#put together
facet_plot(p, data = mytable, geom = geom_bar, panel = "Phylum", colour = "black",
           mapping = aes(fill = as.factor(Phylum),x=Abundance), stat = "identity", orientation="y") +
  geom_tiplab(size = 2)