clusterProfiler
 clusterProfiler copied to clipboard
Use compareCluster with gseKEGG / GSEA?
I tried but it didn't work, so therefore I explicitly would like to ask: is it possible to use compareCluster with gseKEGG (or the generic GSEA function), analogous to the generic enricher function(s) (https://github.com/YuLab-SMU/clusterProfiler/issues/326)? If not, may I kindly put this forward as a feature request?
One reason I am asking is that this may open up the new visualization methods (e.g. treeplot) for multiple GSEA runs.
As you can see below in my R code, gseKEGG is being executed (otherwise the warning on fgseaMultilevel would not be printed), but the results are somehow not 'returned'.
As far as I can see this is because these results are indeed not of class enrichResult nor groupGOResult, so nothing is returned (see:) https://github.com/YuLab-SMU/clusterProfiler/blob/782c27e124302f4c364be3f0f3d3b9995d2971a2/R/compareCluster.R#L65-L66.
As a consequence of this, clProf (and thus clProf.df) are empty, and therefore the error on no enrichment found is printed (see:) https://github.com/YuLab-SMU/clusterProfiler/blob/782c27e124302f4c364be3f0f3d3b9995d2971a2/R/compareCluster.R#L73-L75.
> data(geneList, package="DOSE")
> inputList <- list(rankedGenes1 = geneList, rankedGenes2 = geneList)
> class(inputList)
[1] "list"
> str(inputList)
List of 2
 $ rankedGenes1: Named num [1:12495] 4.57 4.51 4.42 4.14 3.88 ...
  ..- attr(*, "names")= chr [1:12495] "4312" "8318" "10874" "55143" ...
 $ rankedGenes2: Named num [1:12495] 4.57 4.51 4.42 4.14 3.88 ...
  ..- attr(*, "names")= chr [1:12495] "4312" "8318" "10874" "55143" ...
> compareCluster(geneClusters=inputList,  fun = "gseKEGG")
Error in compareCluster(geneClusters = inputList, fun = "gseKEGG") :
  No enrichment found in any of gene cluster, please check your input...
In addition: Warning message:
In fgseaMultilevel(...) :
  For some pathways, in reality P-values are less than 1e-10. You can set the `eps` argument to zero for better estimation.
>
Thanks for implementing this so quickly!
It is almost working; that is:
compareCluster()now nicely accepts gseKEGG (GSEA) as input.- generation of the enrichplot works fine with the
compareClusteroutput.
but....
- the treeplot cannot be generated yet...
This has to do (I think) because the entrezids cannot be converted to symbols, since
setReadablesomehow does not recognize thecompareClusteroutput. See code below.
> library(clusterProfiler)
> library(enrichplot)
> data(geneList, package="DOSE")
> inputList <- list(rankedGenes1 = geneList, rankedGenes2 = geneList)
>
> test.out <- compareCluster(geneClusters=inputList,  fun = "gseKEGG")
Warning message:
In fgseaMultilevel(...) :
  For some pathways, in reality P-values are less than 1e-10. You can set the `eps` argument to zero for better estimation.
>
>
> # So far, so good!
>
> # Let's generate some plots
> # but first calculate term similarities
> test.out <- enrichplot::pairwise_termsim(test.out)
>
> # emappplot is working...!
> emapplot(test.out)
>
> # but treeplot not...
> treeplot(test.out)
Error in strsplit(x$geneID, "/") : non-character argument
>
>
> # A) Try to 'fix' this by using setReadable on compareCluster output...
> # but that doesn't work, even though class(test.out) = "compareClusterResult"...
> # and according to chapter 14.1 of the book this should work.
> # https://yulab-smu.top/biomedical-knowledge-mining-book/clusterprofiler-comparecluster.html#comparing-multiple-gene-lists
> test.out <- setReadable(test.out, 'org.Hs.eg.db', 'ENTREZID')
Error in strsplit(y$geneID, split = "/", fixed = TRUE) :
  non-character argument
>
> class(test.out)
[1] "compareClusterResult"
attr(,"package")
[1] "DOSE"
>
> # B) Try to 'fix' this by using setReadable already on input list,
> # but that didn't work either..
> geneList <- setReadable(geneList, 'org.Hs.eg.db', 'ENTREZID')
Error in setReadable(geneList, "org.Hs.eg.db", "ENTREZID") :
  input should be an 'enrichResult' , 'gseaResult' or 'compareClusterResult' object...
>
> sessionInfo()
R version 4.1.1 Patched (2021-09-28 r80981)
Platform: x86_64-w64-mingw32/x64 (64-bit)
Running under: Windows 10 x64 (build 19042)

Matrix products: default

Random number generation:
 RNG:     Mersenne-Twister
 Normal:  Inversion
 Sample:  Rounding

locale:
[1] LC_COLLATE=English_United States.1252
[2] LC_CTYPE=English_United States.1252
[3] LC_MONETARY=English_United States.1252
[4] LC_NUMERIC=C
[5] LC_TIME=English_United States.1252

attached base packages:
[1] stats4    stats     graphics  grDevices utils     datasets  methods
[8] base

other attached packages:
[1] org.Hs.eg.db_3.14.0   AnnotationDbi_1.56.2  IRanges_2.28.0
[4] S4Vectors_0.32.3      Biobase_2.54.0        BiocGenerics_0.40.0
[7] enrichplot_1.15.1.992 clusterProfiler_4.3.1
BTW, setReadable() does work on the compareCluster output when performing a ORA (so apparently not with a GSEA). (Chapter 14.1).
> data(gcSample)
> str(gcSample)
List of 8
 $ X1: chr [1:216] "4597" "7111" "5266" "2175" ...
 $ X2: chr [1:805] "23450" "5160" "7126" "26118" ...
 $ X3: chr [1:392] "894" "7057" "22906" "3339" ...
 $ X4: chr [1:838] "5573" "7453" "5245" "23450" ...
 $ X5: chr [1:929] "5982" "7318" "6352" "2101" ...
 $ X6: chr [1:585] "5337" "9295" "4035" "811" ...
 $ X7: chr [1:582] "2621" "2665" "5690" "3608" ...
 $ X8: chr [1:237] "2665" "4735" "1327" "3192" ...
> ck <- compareCluster(geneCluster = gcSample, fun = enrichKEGG)
> class(ck)
[1] "compareClusterResult"
attr(,"package")
[1] "DOSE"
>
> ck <- setReadable(ck, OrgDb = org.Hs.eg.db, keyType="ENTREZID")
> # does work on object with class = "compareClusterResult"
Thanks for the advise; I indeed only installed (updated) from github clusterProfiler (v4.3.1) and enrichplot (1.15.1.992).
Unfortunately, when installing DOSE from github (v3.21.1.9001) it did not solve the problem....
> library(clusterProfiler)
> library(enrichplot)
> library(DOSE)
> data(geneList, package="DOSE")
> inputList <- list(rankedGenes1 = geneList, rankedGenes2 = geneList)
> test.out <- compareCluster(geneClusters=inputList,  fun = "gseKEGG")
Warning message:
In fgseaMultilevel(...) :
  For some pathways, in reality P-values are less than 1e-10. You can set the `eps` argument to zero for better estimation.
> test.out <- enrichplot::pairwise_termsim(test.out)
> test.out <- setReadable(test.out, 'org.Hs.eg.db', 'ENTREZID')
Error in strsplit(y$geneID, split = "/", fixed = TRUE) :
  non-character argument
>
> sessionInfo()
R version 4.1.1 Patched (2021-09-28 r80981)
Platform: x86_64-w64-mingw32/x64 (64-bit)
Running under: Windows 10 x64 (build 19042)

Matrix products: default

Random number generation:
 RNG:     Mersenne-Twister
 Normal:  Inversion
 Sample:  Rounding

locale:
[1] LC_COLLATE=English_United States.1252
[2] LC_CTYPE=English_United States.1252
[3] LC_MONETARY=English_United States.1252
[4] LC_NUMERIC=C
[5] LC_TIME=English_United States.1252

attached base packages:
[1] stats4    stats     graphics  grDevices utils     datasets  methods
[8] base

other attached packages:
[1] org.Hs.eg.db_3.14.0   AnnotationDbi_1.56.2  IRanges_2.28.0
[4] S4Vectors_0.32.3      Biobase_2.54.0        BiocGenerics_0.40.0
[7] DOSE_3.21.1.9001      enrichplot_1.15.1.992 clusterProfiler_4.3.1
@guidohooiveld Should be solved by https://github.com/YuLab-SMU/DOSE/pull/61. You can install the latest Github version of DOSE and try again.
Yes, after update DOSE to its latest version the code above is working. Thanks alot!
> library(clusterProfiler)
> library(enrichplot)
> library(DOSE)
> data(geneList, package="DOSE")
> inputList <- list(rankedGenes1 = geneList, rankedGenes2 = geneList)
> test.out <- compareCluster(geneClusters=inputList,  fun = "gseKEGG", pvalueCutoff = 0.05, pAdjustMethod = "none")
> test.out <- enrichplot::pairwise_termsim(test.out)
> test.out <- setReadable(test.out, 'org.Hs.eg.db', 'ENTREZID')
>
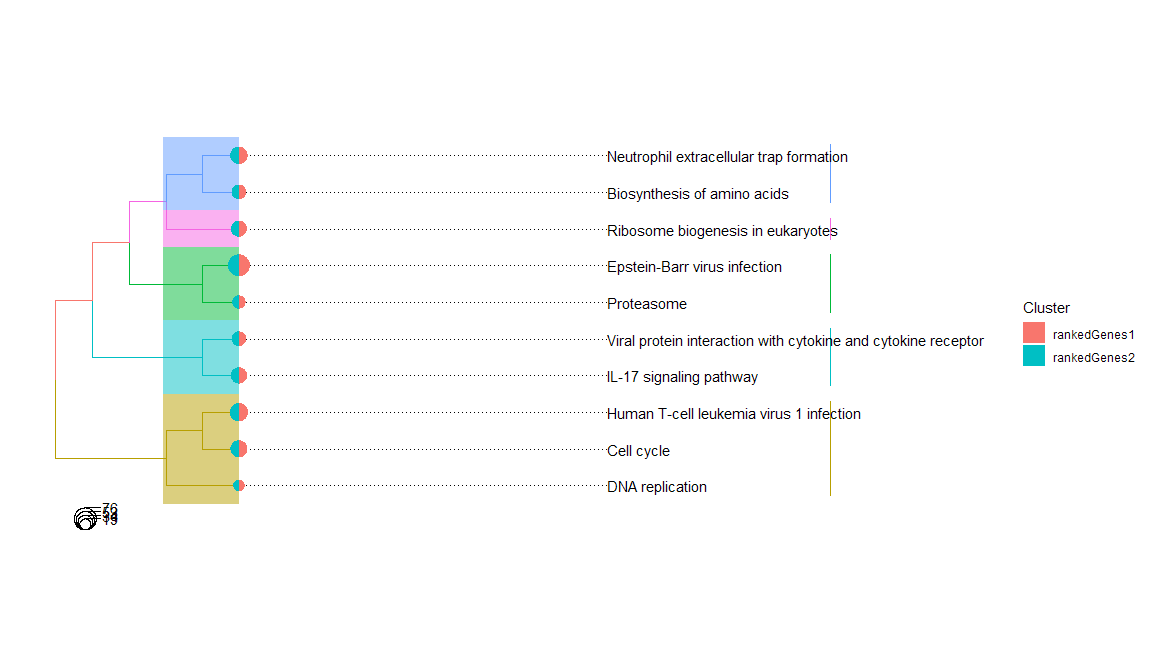
I do have one (not two, anymore!) additional question on visualizing the GSEA output generated by compareCluster with treeplot. I hope you don't mind that I ask them here...
- In the figure below, how to hide the colored, vertical lines that are plotted after the name of each gene set? Thus the vertical blue, pink, green, etc. lines?
I had hoped I would be able to hide them by setting the argument
nWords=0, but that only removed the 'summary names' (but kept the vertical 'cluster' lines).
ADDED after posting this question... I am sorry, but I missed this thread: https://github.com/YuLab-SMU/clusterProfiler/issues/399 Conclusion: this apparently is not possible (yet).
Code to generate the treeplot:
> treeplot(test.out, showCategory = 10, geneClusterPanel= "pie",
+ nWords=0, cex_category=0.5, offset_tiplab=10, pie="Count")
>

- When showing the results as dots in the treeplot, is it possible to split (facet) these by 'activated' and 'suppressed' status? Similarly as what is possible when visualizing the results in a dotplot? I naively tried, but it didn't work...
Related to this: what should be the input for the argument
splitin the functiontreeplot.compareClusterResult? Default issplit = NULL.
Code to generate the (separate) dotplot:
> dotplot(test.out, showCategory=10, split=".sign") + facet_grid(.~.sign)
>

... but it doesn't work when trying to incorporate this layout in the treeplot...
As always, any suggestion is very much appreciated! Also if it would include some separate, additional ggplot2 code...
> treeplot(test.out, showCategory = 10, geneClusterPanel= "dotplot",
+ nWords=0, cex_category=0.5, offset_tiplab=10, split=".sign") + facet_grid(.~.sign)
Error: At least one layer must contain all faceting variables: `.sign`.
* Plot is missing `.sign`
* Layer 1 is missing `.sign`
* Layer 2 is missing `.sign`
* Layer 3 is missing `.sign`
* Layer 4 is missing `.sign`
* Layer 5 is missing `.sign`
* Layer 6 is missing `.sign`
* Layer 7 is missing `.sign`
* Layer 8 is missing `.sign`
* Layer 9 is missing `.sign`
* Layer 10 is missing `.sign`
* Layer 11 is missing `.sign`
Run `rlang::last_error()` to see where the error occurred.
> rlang::last_error()
<error/rlang_error>
At least one layer must contain all faceting variables: `.sign`.
* Plot is missing `.sign`
* Layer 1 is missing `.sign`
* Layer 2 is missing `.sign`
* Layer 3 is missing `.sign`
* Layer 4 is missing `.sign`
* Layer 5 is missing `.sign`
* Layer 6 is missing `.sign`
* Layer 7 is missing `.sign`
* Layer 8 is missing `.sign`
* Layer 9 is missing `.sign`
* Layer 10 is missing `.sign`
* Layer 11 is missing `.sign`
Backtrace:
 1. (function (x, ...) ...
 2. ggplot2:::print.ggplot(x)
 4. ggplot2:::ggplot_build.ggplot(x)
 5. layout$setup(data, plot$data, plot$plot_env)
 6. ggplot2:::f(..., self = self)
 7. self$facet$compute_layout(data, self$facet_params)
 8. ggplot2:::f(...)
 9. ggplot2::combine_vars(data, params$plot_env, cols, drop = params$drop)
Run `rlang::last_trace()` to see the full context.
>
Hi
Thank you for updating this, just what we needed for our work.
We are having the same problem across datasets and computers - the comparecluster function works great, however cannot plot the result as a dotplot (or any other plot) as we get this error:
Error in $<-.data.frame(tmp, "Cluster", value = NA_integer_) : replacement has 1 row, data has 0
Reproducible code:
set.seed(1)
library(DOSE)
data(geneList)
geneList2 <- geneList3 <- geneList
names(geneList2) <- sample(names(geneList))
names(geneList3) <- sample(names(geneList))
mydf2 <- data.frame(Entrez = c(names(geneList), names(geneList2), names(geneList3)),
logFC = c(geneList, geneList2, geneList3),
group = c(rep("A", length(geneList)), rep("B", length(geneList2)),
rep("C", length(geneList3))))
## gseGO
gsea.formula <- compareCluster(Entrez|logFC~group, data=mydf2,
fun='gseGO', OrgDb='org.Hs.eg.db')
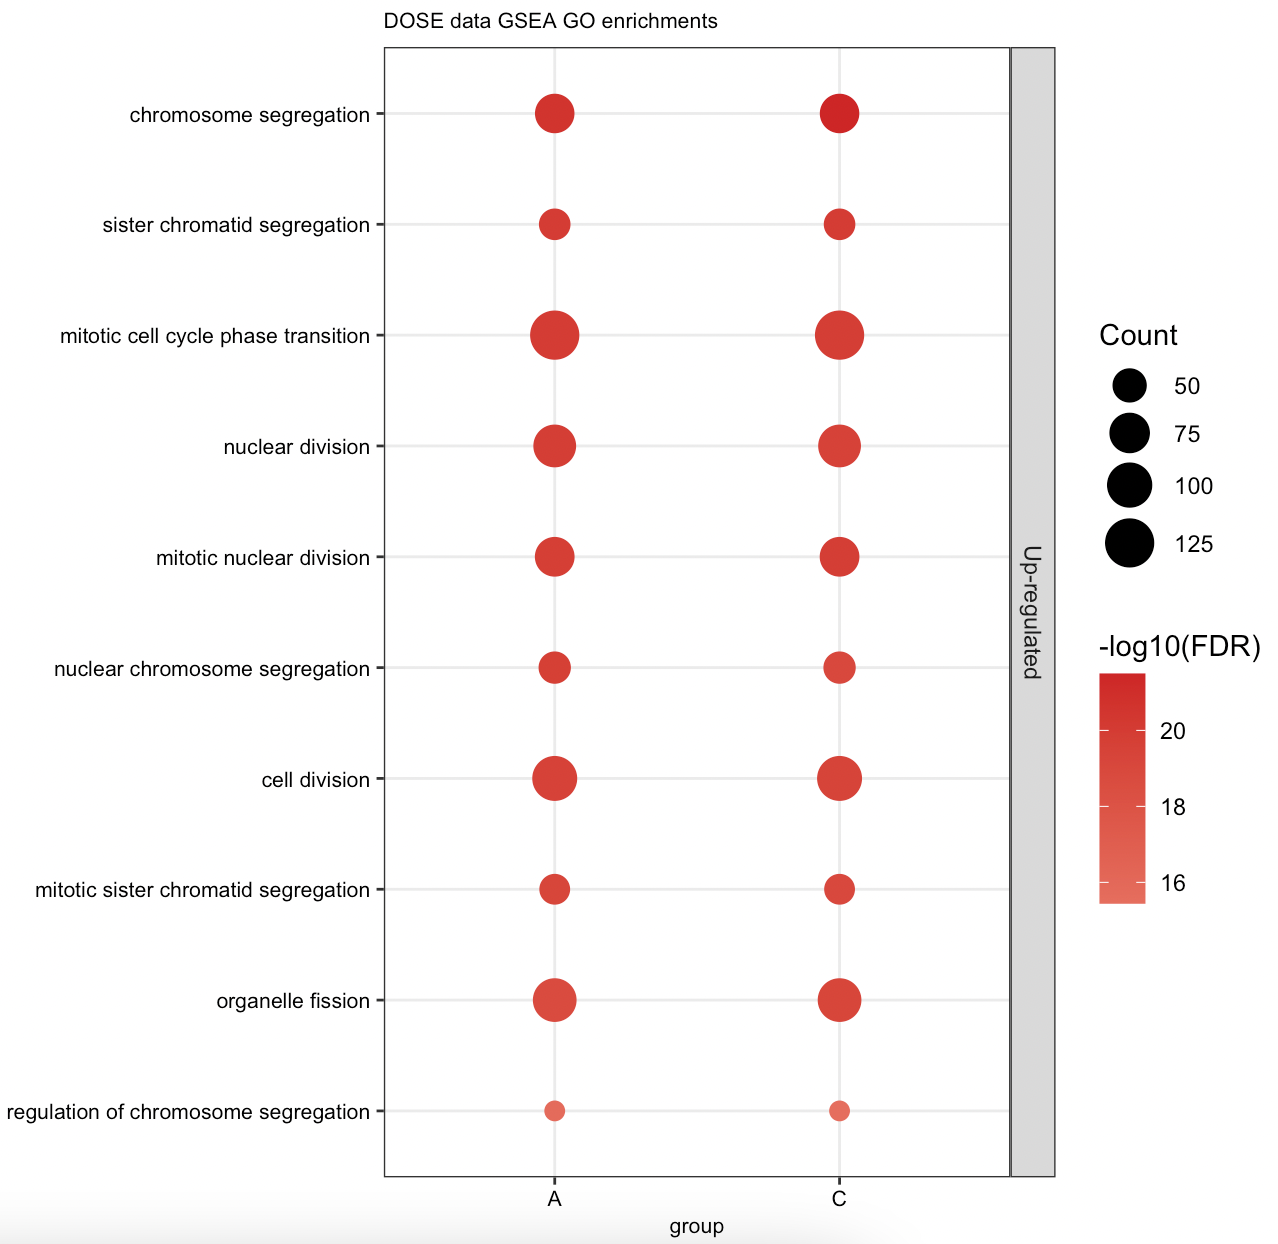
dotplot(gsea.formula)
> Error in `$<-.data.frame`(`*tmp*`, "Cluster", value = NA_integer_) :
replacement has 1 row, data has 0
I have tried this using another method of compiling the data, works but we still get the same error. Packages are up to date from GitHub.
Would appreciate any help on this!
@sarahalshammery Please install the Github version of enrichplot and DOSE.
@sarahalshammery Please install the Github version of
enrichplotandDOSE.
hi @huerqiang as mentioned, I’ve installed the GitHub versions of enrichplot, DOSE and clusterProfiler. Would appreciate any help. Thank you.
@sarahalshammery For your information: though I don't fully know whether the results is what you expected (only in group A (602) enriched gene sets are found), but your code as such doesn't give an error for me.
See also my session info for the versions of clusterProfiler, DOSE and enrichplot.
> set.seed(1)
> library(clusterProfiler)
> library(DOSE)
> data(geneList)
> geneList2 <- geneList3 <- geneList
> names(geneList2) <- sample(names(geneList))
> names(geneList3) <- sample(names(geneList))
> mydf2 <- data.frame(Entrez = c(names(geneList), names(geneList2), names(geneList3)),
+                     logFC = c(geneList, geneList2, geneList3),
+                     group = c(rep("A", length(geneList)), rep("B", length(geneList2)),
+                               rep("C", length(geneList3))))
> ## gseGO
> gsea.formula <- compareCluster(Entrez|logFC~group, data=mydf2,
+                                fun='gseGO', OrgDb='org.Hs.eg.db')
>
> gsea.formula
#
# Result of Comparing 3 gene clusters
#
#.. @fun         gseGO
#.. @geneClusters       List of 3
 $ A: Named num [1:12495] 4.57 4.51 4.42 4.14 3.88 ...
  ..- attr(*, "names")= chr [1:12495] "4312" "8318" "10874" "55143" ...
 $ B: Named num [1:12495] 4.57 4.51 4.42 4.14 3.88 ...
  ..- attr(*, "names")= chr [1:12495] "651" "11232" "27010" "23588" ...
 $ C: Named num [1:12495] 4.57 4.51 4.42 4.14 3.88 ...
  ..- attr(*, "names")= chr [1:12495] "5133" "23024" "23309" "25809" ...
 - attr(*, "split_type")= chr "data.frame"
 - attr(*, "split_labels")='data.frame':        3 obs. of  1 variable:
  ..$ group: chr [1:3] "A" "B" "C"
#...Result      'data.frame':   602 obs. of  13 variables:
 $ Cluster        : Factor w/ 3 levels "A","B","C": 1 1 1 1 1 1 1 1 1 1 ...
 $ group          : chr  "A" "A" "A" "A" ...
 $ ID             : chr  "GO:0000070" "GO:0000819" "GO:0010965" "GO:0051983" ...
 $ Description    : chr  "mitotic sister chromatid segregation" "sister chromatid segregation" "regulation of mitotic sister chromatid separation" "regulation of chromosome segregation" ...
 $ setSize        : int  135 156 52 67 53 57 200 57 51 49 ...
 $ enrichmentScore: num  0.69 0.672 0.783 0.735 0.778 ...
 $ NES            : num  2.97 2.93 2.83 2.83 2.8 ...
 $ pvalue         : num  1e-10 1e-10 1e-10 1e-10 1e-10 ...
 $ p.adjust       : num  1.69e-08 1.69e-08 1.69e-08 1.69e-08 1.69e-08 ...
 $ qvalues        : num  1.37e-08 1.37e-08 1.37e-08 1.37e-08 1.37e-08 ...
 $ rank           : num  532 532 449 449 449 449 449 449 449 449 ...
 $ leading_edge   : chr  "tags=30%, list=4%, signal=29%" "tags=28%, list=4%, signal=27%" "tags=42%, list=4%, signal=41%" "tags=36%, list=4%, signal=35%" ...
 $ core_enrichment: chr  "55143/991/9493/1062/10403/23397/9787/11065/51203/10460/4751/4085/81930/81620/7272/64151/9212/9319/9055/3833/146"| __truncated__ "55143/991/9493/1062/10403/7153/23397/9787/11065/51203/10460/4751/4085/81930/81620/7272/64151/9212/9319/9055/383"| __truncated__ "1062/10403/9787/11065/10460/4085/81620/7272/9212/9319/891/9232/990/5347/26255/701/11130/9700/699/1063/26271/55055" "1062/10403/9787/11065/10460/4085/81620/7272/9212/9319/891/9232/11004/990/5347/26255/701/11130/9700/4288/699/1063/26271/55055" ...
#.. number of enriched terms found for each gene cluster:
#..   A: 602
#..   B: 0
#..   C: 0
#
#...Citation
T Wu, E Hu, S Xu, M Chen, P Guo, Z Dai, T Feng, L Zhou,
W Tang, L Zhan, X Fu, S Liu, X Bo, and G Yu.
clusterProfiler 4.0: A universal enrichment tool for interpreting omics data.
The Innovation. 2021, 2(3):100141

>
>
> dotplot(gsea.formula)
>

> sessionInfo()
R version 4.1.1 Patched (2021-09-28 r80981)
Platform: x86_64-w64-mingw32/x64 (64-bit)
Running under: Windows 10 x64 (build 19042)

Matrix products: default

Random number generation:
 RNG:     Mersenne-Twister
 Normal:  Inversion
 Sample:  Rounding

locale:
[1] LC_COLLATE=English_United States.1252
[2] LC_CTYPE=English_United States.1252
[3] LC_MONETARY=English_United States.1252
[4] LC_NUMERIC=C
[5] LC_TIME=English_United States.1252

attached base packages:
[1] stats4    stats     graphics  grDevices utils     datasets  methods
[8] base

other attached packages:
[1] org.Hs.eg.db_3.14.0       AnnotationDbi_1.56.2
[3] IRanges_2.28.0            S4Vectors_0.32.3
[5] Biobase_2.54.0            BiocGenerics_0.40.0
[7] clusterProfiler_4.3.1.900 DOSE_3.21.2

loaded via a namespace (and not attached):
 [1] nlme_3.1-153           bitops_1.0-7           ggtree_3.2.1
 [4] enrichplot_1.15.2      bit64_4.0.5            RColorBrewer_1.1-2
<<snip>>
Thank you for your help @guidohooiveld and showing your session info! I for some reason had downloaded enrichplot through install_github("guangchuangyu/enrichplot") instead of devtools::install_github("YuLab-SMU/enrichplot"). Worked great and was able to make my plots.
About using compareCluster result to plot the treeplot, I cannot repeat the result. And here is the error that looks like:
> treeplot(test.out, showCategory = 10, geneClusterPanel= "pie", nWords=0, cex_category=0.5, offset_tiplab=10, pie="Count")
Error in `geom_segment2()`:
! Problem while converting geom to grob.
ℹ Error occurred in the 6th layer.
Caused by error in `check.length()`:
! 'gpar' element 'lwd' must not be length 0
Run `rlang::last_error()` to see where the error occurred.
After I googled the error information, somehow it seems to be the ggplot version problem. But I'm not sure about that. And here is my session infomation:
> sessionInfo()
R version 4.2.1 (2022-06-23 ucrt)
Platform: x86_64-w64-mingw32/x64 (64-bit)
Running under: Windows 10 x64 (build 22000)

Matrix products: default

locale:
[1] LC_COLLATE=Chinese (Simplified)_China.utf8  LC_CTYPE=Chinese (Simplified)_China.utf8
[3] LC_MONETARY=Chinese (Simplified)_China.utf8 LC_NUMERIC=C
[5] LC_TIME=Chinese (Simplified)_China.utf8

attached base packages:
[1] grid      stats4    stats     graphics  grDevices utils     datasets  methods   base

other attached packages:
 [1] DOSE_3.22.1                               enrichplot_1.16.2
 [3] patchwork_1.1.2                           ComplexHeatmap_2.12.1
 [5] rstatix_0.7.1                             ggpubr_0.5.0
 [7] GOSemSim_2.22.0                           rtracklayer_1.56.1
 [9] annotatr_1.22.0                           TxDb.Mmusculus.UCSC.mm10.knownGene_3.10.0
[11] GenomicFeatures_1.48.4                    clusterProfiler_4.4.4
[13] ChIPseeker_1.32.1                         genomation_1.28.0
[15] ggdendro_0.1.23                           methylKit_1.22.0
[17] stringr_1.4.1                             ggraph_2.1.0
[19] tidygraph_1.2.2                           ggbiplot_0.6
[21] edgeR_3.38.4                              limma_3.52.4
[23] pathview_1.36.1                           viridis_0.6.2
[25] viridisLite_0.4.1                         RColorBrewer_1.1-3
[27] clValid_0.7                               cluster_2.1.4
[29] cowplot_1.1.1                             org.Mm.eg.db_3.15.0
[31] AnnotationDbi_1.58.0                      ggplot2_3.4.0
[33] DESeq2_1.36.0                             SummarizedExperiment_1.26.1
[35] Biobase_2.56.0                            MatrixGenerics_1.8.1
[37] matrixStats_0.63.0                        GenomicRanges_1.48.0
[39] GenomeInfoDb_1.32.4                       IRanges_2.32.0
[41] S4Vectors_0.34.0                          BiocGenerics_0.42.0
[43] dplyr_1.0.10

loaded via a namespace (and not attached):
  [1] rappdirs_0.3.3                          R.methodsS3_1.8.2
  [3] coda_0.19-4                             tidyr_1.2.1
  [5] bit64_4.0.5                             knitr_1.41
  [7] DelayedArray_0.22.0                     R.utils_2.12.2
  [9] data.table_1.14.6                       KEGGREST_1.36.3
 [11] RCurl_1.98-1.9                          doParallel_1.0.17
 [13] generics_0.1.3                          snow_0.4-4
 [15] RSQLite_2.2.19                          shadowtext_0.1.2
 [17] bit_4.0.5                               tzdb_0.3.0
 [19] httpuv_1.6.6                            xml2_1.3.3
 [21] assertthat_0.2.1                        xfun_0.35
 [23] hms_1.1.2                               promises_1.2.0.1
 [25] evaluate_0.18                           fansi_1.0.3
 [27] restfulr_0.0.15                         progress_1.2.2
 [29] caTools_1.18.2                          dbplyr_2.2.1
 [31] Rgraphviz_2.40.0                        igraph_1.3.5
 [33] DBI_1.1.3                               geneplotter_1.74.0
 [35] purrr_0.3.5                             ellipsis_0.3.2
 [37] ggnewscale_0.4.8                        backports_1.4.1
 [39] annotate_1.74.0                         gridBase_0.4-7
 [41] biomaRt_2.52.0                          vctrs_0.5.1
 [43] abind_1.4-5                             cachem_1.0.6
 [45] withr_2.5.0                             RVenn_1.1.0
 [47] ggforce_0.4.1                           BSgenome_1.64.0
 [49] bdsmatrix_1.3-6                         GenomicAlignments_1.32.1
 [51] treeio_1.20.2                           prettyunits_1.1.1
 [53] mclust_6.0.0                            ape_5.6-2
 [55] lazyeval_0.2.2                          crayon_1.5.2
 [57] genefilter_1.78.0                       labeling_0.4.2
 [59] pkgconfig_2.0.3                         tweenr_2.0.2
 [61] nlme_3.1-160                            rlang_1.0.6
 [63] lifecycle_1.0.3                         downloader_0.4
 [65] filelock_1.0.2                          BiocFileCache_2.4.0
 [67] seqPattern_1.28.0                       AnnotationHub_3.4.0
 [69] polyclip_1.10-4                         graph_1.74.0
 [71] Matrix_1.5-3                            aplot_0.1.9
 [73] carData_3.0-5                           boot_1.3-28.1
 [75] GlobalOptions_0.1.2                     pheatmap_1.0.12
 [77] png_0.1-7                               rjson_0.2.21
 [79] bitops_1.0-7                            R.oo_1.25.0
 [81] KernSmooth_2.23-20                      Biostrings_2.66.0
 [83] blob_1.2.3                              shape_1.4.6
 [85] qvalue_2.28.0                           regioneR_1.28.0
 [87] readr_2.1.3                             gridGraphics_0.5-1
 [89] ggsignif_0.6.4                          scales_1.2.1
 [91] memoise_2.0.1                           magrittr_2.0.3
 [93] plyr_1.8.8                              gplots_3.1.3
 [95] zlibbioc_1.42.0                         compiler_4.2.1
 [97] scatterpie_0.1.8                        BiocIO_1.6.0
 [99] bbmle_1.0.25                            plotrix_3.8-2
[101] clue_0.3-63                             KEGGgraph_1.56.0
[103] fastseg_1.42.0                          Rsamtools_2.12.0
[105] cli_3.4.1                               XVector_0.38.0
[107] MASS_7.3-58.1                           tidyselect_1.2.0
[109] stringi_1.7.8                           emdbook_1.3.12
[111] yaml_2.3.6                              locfit_1.5-9.6
[113] ggrepel_0.9.2                           fastmatch_1.1-3
[115] tools_4.2.1                             parallel_4.2.1
[117] circlize_0.4.15                         rstudioapi_0.14
[119] foreach_1.5.2                           TxDb.Hsapiens.UCSC.hg19.knownGene_3.2.2
[121] eulerr_6.1.1                            gridExtra_2.3
[123] farver_2.1.1                            BiocManager_1.30.19
[125] digest_0.6.30                           shiny_1.7.3
[127] Rcpp_1.0.9                              car_3.1-1
[129] broom_1.0.1                             later_1.3.0
[131] BiocVersion_3.15.2                      org.Hs.eg.db_3.15.0
[133] httr_1.4.4                              colorspace_2.0-3
[135] XML_3.99-0.12                           splines_4.2.1
[137] ggVennDiagram_1.2.2                     yulab.utils_0.0.5
[139] tidytree_0.4.1                          graphlayouts_0.8.4
[141] ggplotify_0.1.0                         xtable_1.8-4
[143] jsonlite_1.8.3                          ggtree_3.4.4
[145] ggfun_0.0.9                             R6_2.5.1
[147] mime_0.12                               pillar_1.8.1
[149] htmltools_0.5.3                         glue_1.6.2
[151] fastmap_1.1.0                           BiocParallel_1.30.4
[153] interactiveDisplayBase_1.34.0           class_7.3-20
[155] codetools_0.2-18                        fgsea_1.22.0
[157] mvtnorm_1.1-3                           utf8_1.2.2
[159] lattice_0.20-45                         tibble_3.1.8
[161] numDeriv_2016.8-1.1                     curl_4.3.3
[163] gtools_3.9.4                            GO.db_3.15.0
[165] survival_3.4-0                          rmarkdown_2.18
[167] munsell_0.5.0                           DO.db_2.9
[169] GetoptLong_1.0.5                        GenomeInfoDbData_1.2.8
[171] iterators_1.0.14                        impute_1.70.0
[173] reshape2_1.4.4                          gtable_0.3.1
Yes, after update
DOSEto its latest version the code above is working. Thanks alot!> library(clusterProfiler) > library(enrichplot) > library(DOSE) > data(geneList, package="DOSE") > inputList <- list(rankedGenes1 = geneList, rankedGenes2 = geneList) > test.out <- compareCluster(geneClusters=inputList, fun = "gseKEGG", pvalueCutoff = 0.05, pAdjustMethod = "none") > test.out <- enrichplot::pairwise_termsim(test.out) > test.out <- setReadable(test.out, 'org.Hs.eg.db', 'ENTREZID') >I do have one (not two, anymore!) additional question on visualizing the GSEA output generated by
compareClusterwithtreeplot. I hope you don't mind that I ask them here...
- In the figure below, how to hide the colored, vertical lines that are plotted after the name of each gene set? Thus the vertical blue, pink, green, etc. lines? I had hoped I would be able to hide them by setting the argument
nWords=0, but that only removed the 'summary names' (but kept the vertical 'cluster' lines).ADDED after posting this question... I am sorry, but I missed this thread: #399 Conclusion: this apparently is not possible (yet).
Code to generate the treeplot:
> treeplot(test.out, showCategory = 10, geneClusterPanel= "pie",
+ nWords=0, cex_category=0.5, offset_tiplab=10, pie="Count")
>
- When showing the results as dots in the treeplot, is it possible to split (facet) these by 'activated' and 'suppressed' status? Similarly as what is possible when visualizing the results in a dotplot? I naively tried, but it didn't work... Related to this: what should be the input for the argument
splitin the functiontreeplot.compareClusterResult? Default issplit = NULL.Code to generate the (separate) dotplot:
> dotplot(test.out, showCategory=10, split=".sign") + facet_grid(.~.sign)
>
... but it doesn't work when trying to incorporate this layout in the treeplot...
As always, any suggestion is very much appreciated! Also if it would include some separate, additional
ggplot2code...> treeplot(test.out, showCategory = 10, geneClusterPanel= "dotplot", + nWords=0, cex_category=0.5, offset_tiplab=10, split=".sign") + facet_grid(.~.sign) Error: At least one layer must contain all faceting variables: `.sign`. * Plot is missing `.sign` * Layer 1 is missing `.sign` * Layer 2 is missing `.sign` * Layer 3 is missing `.sign` * Layer 4 is missing `.sign` * Layer 5 is missing `.sign` * Layer 6 is missing `.sign` * Layer 7 is missing `.sign` * Layer 8 is missing `.sign` * Layer 9 is missing `.sign` * Layer 10 is missing `.sign` * Layer 11 is missing `.sign` Run `rlang::last_error()` to see where the error occurred. > rlang::last_error() <error/rlang_error> At least one layer must contain all faceting variables: `.sign`. * Plot is missing `.sign` * Layer 1 is missing `.sign` * Layer 2 is missing `.sign` * Layer 3 is missing `.sign` * Layer 4 is missing `.sign` * Layer 5 is missing `.sign` * Layer 6 is missing `.sign` * Layer 7 is missing `.sign` * Layer 8 is missing `.sign` * Layer 9 is missing `.sign` * Layer 10 is missing `.sign` * Layer 11 is missing `.sign` Backtrace: 1. (function (x, ...) ... 2. ggplot2:::print.ggplot(x) 4. ggplot2:::ggplot_build.ggplot(x) 5. layout$setup(data, plot$data, plot$plot_env) 6. ggplot2:::f(..., self = self) 7. self$facet$compute_layout(data, self$facet_params) 8. ggplot2:::f(...) 9. ggplot2::combine_vars(data, params$plot_env, cols, drop = params$drop) Run `rlang::last_trace()` to see the full context. >
@Lucyyang1991: I would recommend you update your R and Bioconductor installations to their latest versions, since your (my) code then still is running fine.
Please note that some warnings are returned because apparently some parameters will be removed in the next release of clusterProfiler / enrichPlot. Yet, you can already use the 'new' way of providing plotting arguments as lists. See code below.
> library(clusterProfiler)
> library(enrichplot)
> library(DOSE)
>
> data(geneList, package="DOSE")
>
> inputList <- list(rankedGenes1 = geneList, rankedGenes2 = geneList)
>
> test.out <- compareCluster(geneClusters=inputList,  fun = "gseKEGG", eps = 0,
+             pvalueCutoff = 0.05, pAdjustMethod = "none")
> test.out <- enrichplot::pairwise_termsim(test.out)
> test.out <- setReadable(test.out, 'org.Hs.eg.db', 'ENTREZID')
>
> ## create treeplot using 'old' code.
> ## Graph is generated, but note the deprecation warnings.
> treeplot(test.out, showCategory = 10, geneClusterPanel= "pie",
+          nWords=0, cex_category=0.5, offset_tiplab=10, pie="Count")
Warning messages:
1: In treeplot.compareClusterResult(x, ...) :
  Use 'cluster.params = list(label_words_n = your_value)' instead of 'nWords'.
 The nWords parameter will be removed in the next version.
2: In treeplot.compareClusterResult(x, ...) :
  Use 'clusterPanel.params = list(clusterPanel = your_value)' instead of 'geneClusterPanel'.
 The geneClusterPanel parameter will be removed in the next version.
3: In treeplot.compareClusterResult(x, ...) :
  Use 'clusterPanel.params = list(pie = your_value)' instead of 'pie'.
 The pie parameter will be removed in the next version.
4: In treeplot.compareClusterResult(x, ...) :
  Use 'offset.params = list(tiplab = your_value)' instead of 'offset_tiplab'.
 The offset_tiplab parameter will be removed in the next version.
>
>
> ## adapt arguments for treeplot function
> cluster.params = list(label_words_n = 0)
> clusterPanel.params = list(clusterPanel = "pie",  pie = "Count")
> offset.params = list(tiplab = 10)
>
>
> treeplot(test.out, showCategory = 10, cex_category=0.5, clusterPanel.params = clusterPanel.params,
+          cluster.params = cluster.params, offset.params = offset.params)
>
>
> sessionInfo()
R version 4.2.2 (2022-10-31 ucrt)
Platform: x86_64-w64-mingw32/x64 (64-bit)
Running under: Windows 10 x64 (build 19042)

Matrix products: default

Random number generation:
 RNG:     Mersenne-Twister
 Normal:  Inversion
 Sample:  Rounding

locale:
[1] LC_COLLATE=English_United States.utf8
[2] LC_CTYPE=English_United States.utf8
[3] LC_MONETARY=English_United States.utf8
[4] LC_NUMERIC=C
[5] LC_TIME=English_United States.utf8

attached base packages:
[1] stats     graphics  grDevices utils     datasets  methods   base

other attached packages:
[1] DOSE_3.24.2           enrichplot_1.18.3     clusterProfiler_4.6.0

loaded via a namespace (and not attached):
  [1] nlme_3.1-161           bitops_1.0-7           ggtree_3.6.2
  [4] bit64_4.0.5            HDO.db_0.99.1          RColorBrewer_1.1-3
  [7] httr_1.4.4             GenomeInfoDb_1.34.4    tools_4.2.2
 [10] utf8_1.2.2             R6_2.5.1               lazyeval_0.2.2
 [13] DBI_1.1.3              BiocGenerics_0.44.0    colorspace_2.0-3
 [16] withr_2.5.0            tidyselect_1.2.0       gridExtra_2.3
 [19] bit_4.0.5              compiler_4.2.2         cli_3.4.1
 [22] Biobase_2.58.0         scatterpie_0.1.8       labeling_0.4.2
 [25] shadowtext_0.1.2       scales_1.2.1           yulab.utils_0.0.5
 [28] stringr_1.5.0          digest_0.6.31          gson_0.0.9
 [31] XVector_0.38.0         pkgconfig_2.0.3        fastmap_1.1.0
 [34] rlang_1.0.6            RSQLite_2.2.19         gridGraphics_0.5-1
 [37] farver_2.1.1           generics_0.1.3         jsonlite_1.8.4
 [40] BiocParallel_1.32.4    GOSemSim_2.24.0        dplyr_1.0.10
 [43] RCurl_1.98-1.9         magrittr_2.0.3         ggplotify_0.1.0
 [46] GO.db_3.16.0           GenomeInfoDbData_1.2.9 patchwork_1.1.2
 [49] Matrix_1.5-3           Rcpp_1.0.9             munsell_0.5.0
 [52] S4Vectors_0.36.1       fansi_1.0.3            ggnewscale_0.4.8
 [55] ape_5.6-2              viridis_0.6.2          lifecycle_1.0.3
 [58] stringi_1.7.8          ggraph_2.1.0           MASS_7.3-58.1
 [61] zlibbioc_1.44.0        org.Hs.eg.db_3.16.0    plyr_1.8.8
 [64] qvalue_2.30.0          grid_4.2.2             blob_1.2.3
 [67] parallel_4.2.2         ggrepel_0.9.2          crayon_1.5.2
 [70] lattice_0.20-45        graphlayouts_0.8.4     Biostrings_2.66.0
 [73] cowplot_1.1.1          splines_4.2.2          KEGGREST_1.38.0
 [76] pillar_1.8.1           fgsea_1.24.0           igraph_1.3.5
 [79] reshape2_1.4.4         codetools_0.2-18       stats4_4.2.2
 [82] fastmatch_1.1-3        glue_1.6.2             ggfun_0.0.9
 [85] downloader_0.4         data.table_1.14.6      treeio_1.22.0
 [88] png_0.1-8              vctrs_0.5.1            tweenr_2.0.2
 [91] gtable_0.3.1           purrr_0.3.5            polyclip_1.10-4
 [94] tidyr_1.2.1            assertthat_0.2.1       cachem_1.0.6
 [97] ggplot2_3.4.0          ggforce_0.4.1          tidygraph_1.2.2
[100] tidytree_0.4.1         viridisLite_0.4.1      snow_0.4-4
[103] tibble_3.1.8           aplot_0.1.9            AnnotationDbi_1.60.0
[106] memoise_2.0.1          IRanges_2.32.0         ellipsis_0.3.2
>
>
>
@guidohooiveld So grateful for your reply! I updated all the packages and R version according to your suggestion and run the codes you provided. But still got the same error information. Below is the code and error information.
Loading required package: DOSE

DOSE v3.22.1  For help: https://yulab-smu.top/biomedical-knowledge-mining-book/

If you use DOSE in published research, please cite:
Guangchuang Yu, Li-Gen Wang, Guang-Rong Yan, Qing-Yu He. DOSE: an R/Bioconductor package for Disease Ontology Semantic and Enrichment analysis. Bioinformatics 2015, 31(4):608-609

> library(clusterProfiler)
clusterProfiler v4.4.4  For help: https://yulab-smu.top/biomedical-knowledge-mining-book/

If you use clusterProfiler in published research, please cite:
T Wu, E Hu, S Xu, M Chen, P Guo, Z Dai, T Feng, L Zhou, W Tang, L Zhan, X Fu, S Liu, X Bo, and G Yu. clusterProfiler 4.0: A universal enrichment tool for interpreting omics data. The Innovation. 2021, 2(3):100141

Attaching package: ‘clusterProfiler’

The following object is masked from ‘package:stats’:

    filter

> library(enrichplot)
> library(DOSE)
> data(geneList, package="DOSE")
> inputList <- list(rankedGenes1 = geneList, rankedGenes2 = geneList)
> test.out <- compareCluster(geneClusters=inputList,  fun = "gseKEGG", eps = 0, pvalueCutoff = 0.05, pAdjustMethod = "none")
There were 14 warnings (use warnings() to see them)
> test.out <- enrichplot::pairwise_termsim(test.out)
> test.out <- setReadable(test.out, 'org.Hs.eg.db', 'ENTREZID')
> ## adapt arguments for treeplot function
> cluster.params = list(label_words_n = 0)
> clusterPanel.params = list(clusterPanel = "pie",  pie = "Count")
> offset.params = list(tiplab = 10)
> treeplot(test.out, showCategory = 10, cex_category=0.5, clusterPanel.params = clusterPanel.params,
+                    cluster.params = cluster.params, offset.params = offset.params)
Scale for fill is already present.
Adding another scale for fill, which will replace the existing scale.
Error in `geom_segment2()`:
! Problem while converting geom to grob.
ℹ Error occurred in the 6th layer.
Caused by error in `check.length()`:
! 'gpar' element 'lwd' must not be length 0
Run `rlang::last_error()` to see where the error occurred.
The sessionInfo is attatched:
> sessionInfo()
R version 4.2.2 (2022-10-31 ucrt)
Platform: x86_64-w64-mingw32/x64 (64-bit)
Running under: Windows 10 x64 (build 22000)

Matrix products: default

locale:
[1] LC_COLLATE=Chinese (Simplified)_China.utf8  LC_CTYPE=Chinese (Simplified)_China.utf8    LC_MONETARY=Chinese (Simplified)_China.utf8 LC_NUMERIC=C                                LC_TIME=Chinese (Simplified)_China.utf8

attached base packages:
[1] stats     graphics  grDevices utils     datasets  methods   base

other attached packages:
[1] enrichplot_1.16.2     clusterProfiler_4.4.4 DOSE_3.22.1

loaded via a namespace (and not attached):
  [1] ggnewscale_0.4.8       fgsea_1.22.0           colorspace_2.0-3       ggtree_3.4.4           rjson_0.2.21           ellipsis_0.3.2         circlize_0.4.15        qvalue_2.28.0          XVector_0.38.0
 [10] GlobalOptions_0.1.2    aplot_0.1.9            clue_0.3-63            rstudioapi_0.14        farver_2.1.1           graphlayouts_0.8.4     ggrepel_0.9.2          bit64_4.0.5            AnnotationDbi_1.58.0
 [19] fansi_1.0.3            scatterpie_0.1.8       codetools_0.2-18       splines_4.2.2          doParallel_1.0.17      cachem_1.0.6           GOSemSim_2.22.0        knitr_1.41             polyclip_1.10-4
 [28] jsonlite_1.8.4         broom_1.0.2            cluster_2.1.4          GO.db_3.15.0           png_0.1-8              pheatmap_1.0.12        ggforce_0.4.1          compiler_4.2.2         httr_1.4.4
 [37] backports_1.4.1        assertthat_0.2.1       Matrix_1.5-3           fastmap_1.1.0          lazyeval_0.2.2         cli_3.6.0              tweenr_2.0.2           htmltools_0.5.4        tools_4.2.2
 [46] igraph_1.3.5           gtable_0.3.1           glue_1.6.2             GenomeInfoDbData_1.2.8 reshape2_1.4.4         DO.db_2.9              dplyr_1.0.10           fastmatch_1.1-3        Rcpp_1.0.9
 [55] carData_3.0-5          Biobase_2.56.0         vctrs_0.5.1            Biostrings_2.66.0      ape_5.6-2              nlme_3.1-161           iterators_1.0.14       ggraph_2.1.0           xfun_0.36
 [64] stringr_1.5.0          lifecycle_1.0.3        rstatix_0.7.1          org.Hs.eg.db_3.15.0    zlibbioc_1.42.0        MASS_7.3-58.1          scales_1.2.1           tidygraph_1.2.2        parallel_4.2.2
 [73] RColorBrewer_1.1-3     ComplexHeatmap_2.12.1  yaml_2.3.6             memoise_2.0.1          gridExtra_2.3          ggplot2_3.4.0          downloader_0.4         ggfun_0.0.9            yulab.utils_0.0.6
 [82] stringi_1.7.12         RSQLite_2.2.20         S4Vectors_0.34.0       foreach_1.5.2          tidytree_0.4.2         BiocGenerics_0.42.0    BiocParallel_1.30.4    shape_1.4.6            GenomeInfoDb_1.32.4
 [91] rlang_1.0.6            pkgconfig_2.0.3        bitops_1.0-7           matrixStats_0.63.0     evaluate_0.20          lattice_0.20-45        purrr_1.0.1            labeling_0.4.2         treeio_1.20.2
[100] patchwork_1.1.2        shadowtext_0.1.2       bit_4.0.5              tidyselect_1.2.0       plyr_1.8.8             magrittr_2.0.3         R6_2.5.1               snow_0.4-4             IRanges_2.32.0
[109] generics_0.1.3         DBI_1.1.3              pillar_1.8.1           withr_2.5.0            abind_1.4-5            KEGGREST_1.36.3        RCurl_1.98-1.9         tibble_3.1.8           car_3.1-1
[118] crayon_1.5.2           utf8_1.2.2             rmarkdown_2.19         GetoptLong_1.0.5       viridis_0.6.2          grid_4.2.2             data.table_1.14.6      blob_1.2.3             digest_0.6.31
[127] tidyr_1.2.1            gridGraphics_0.5-1     stats4_4.2.2           munsell_0.5.0          viridisLite_0.4.1      ggplotify_0.1.0
@Lucyyang1991
The code you just posted still/again works fine for me...
However, after comparing your sessionInfo() with that of mine I noticed that you are indeed running the latest version of R (R-4.2.2); yet your Bioconductor installation, and thus your packages, are still from the previous Bioconductor release.
Your installation: R-4.2.2 + Bioconductor release 3.15; my installation R-4.2.2 (=same) + Bioconductor release 3.16 (= latest release).
Your installation: enrichplot_1.16.2, clusterProfiler_4.4.4, DOSE_3.22.1, org.Hs.eg.db_3.15.0.
My installation: enrichplot_1.18.3, clusterProfiler_4.6.0, DOSE_3.24.2, org.Hs.eg.db_3.16.0.
Thus: please upgrade your installed Bioconductor packages using (in a fresh session):
install.packages("BiocManager")
BiocManager::install(version = "3.16")
and let us know the outcome.
@guidohooiveld Thanks so much for all the replies, it really works! Best wishes~