rippled
 rippled copied to clipboard
ledger sync gap problem
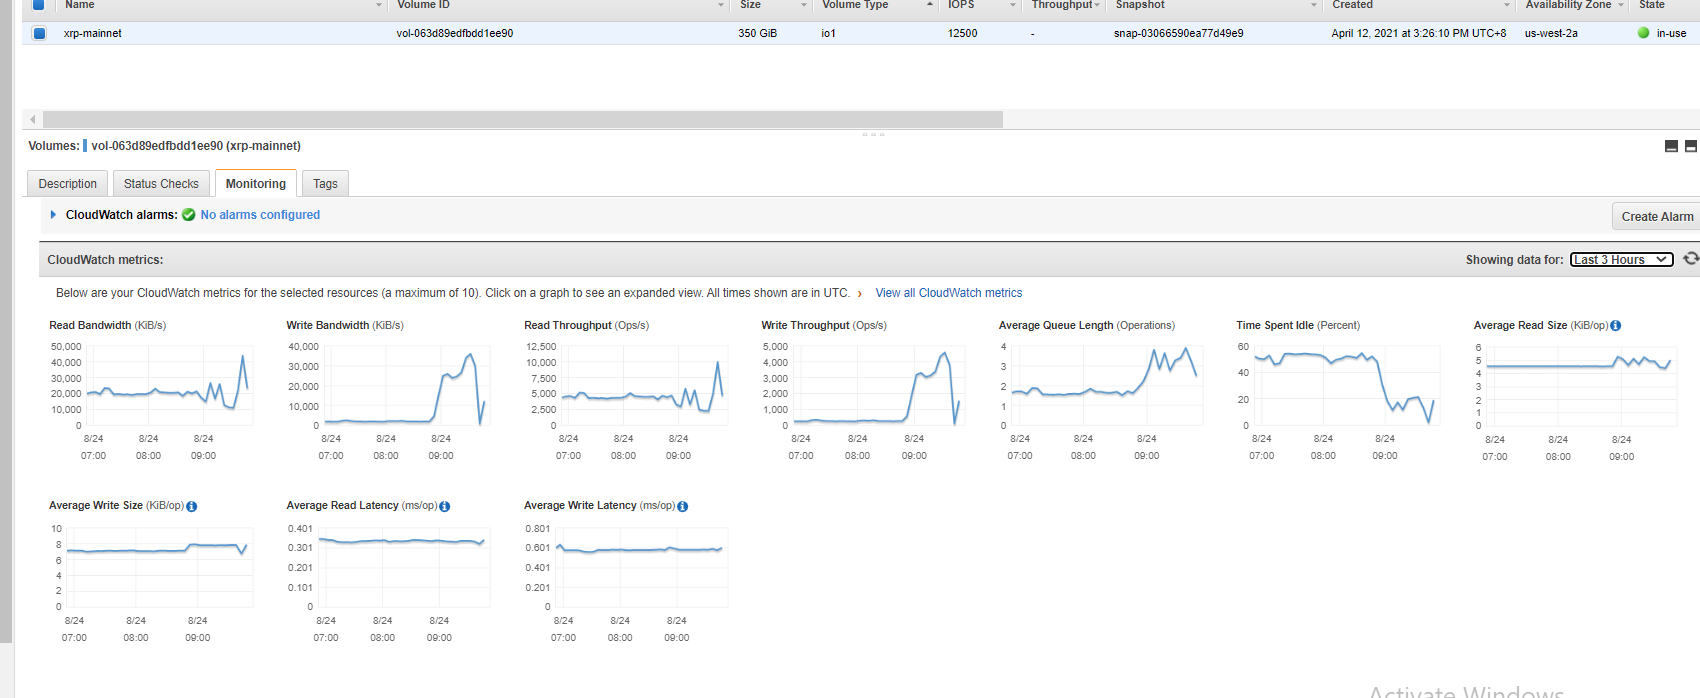
We set up a node use docker image from https://hub.docker.com/r/xrptipbot/rippled/ But it reports ledger gap frequently, maybe two or three days a time, or once per month.
It seem to have relation with IOPS ( This server is aws ec2 with a 350GB SSD of 12500 IOPS ), but I don't sure.
I check with iostat -x 1, got:
Linux 4.14.219-164.354.amzn2.x86_64 (ip-10-251-1-212.us-west-2.compute.internal) 	08/24/2021 	_x86_64_	(4 CPU)

avg-cpu:  %user   %nice %system %iowait  %steal   %idle
           5.77    0.00    4.26   11.29    0.01   78.66

Device:         rrqm/s   wrqm/s     r/s     w/s    rkB/s    wkB/s avgrq-sz avgqu-sz   await r_await w_await  svctm  %util
nvme0n1           0.00    12.65 2687.08  320.08 12393.61  2285.10     9.76     0.28    0.06    0.12    0.73   0.09  26.46

avg-cpu:  %user   %nice %system %iowait  %steal   %idle
          10.94    0.00   11.72   44.27    0.00   33.07

Device:         rrqm/s   wrqm/s     r/s     w/s    rkB/s    wkB/s avgrq-sz avgqu-sz   await r_await w_await  svctm  %util
nvme0n1           0.00    27.00 8047.00 4225.00 40344.00 33476.00    12.03     6.92    0.63    0.50    0.88   0.07  86.00

avg-cpu:  %user   %nice %system %iowait  %steal   %idle
           2.55    0.00    2.81   16.07    0.00   78.57

Device:         rrqm/s   wrqm/s     r/s     w/s    rkB/s    wkB/s avgrq-sz avgqu-sz   await r_await w_await  svctm  %util
nvme0n1           0.00    22.00 1921.00  317.00 11696.00  2096.00    12.33     0.27    0.52    0.50    0.69   0.02   4.80

avg-cpu:  %user   %nice %system %iowait  %steal   %idle
           5.94    0.00    5.43   16.28    0.26   72.09

Device:         rrqm/s   wrqm/s     r/s     w/s    rkB/s    wkB/s avgrq-sz avgqu-sz   await r_await w_await  svctm  %util
nvme0n1           0.00    12.00 3040.00 4133.00 16704.00 32780.00    13.80     4.02    0.68    0.51    0.80   0.07  51.60

avg-cpu:  %user   %nice %system %iowait  %steal   %idle
           7.87    0.00   10.15   44.16    0.00   37.82

Device:         rrqm/s   wrqm/s     r/s     w/s    rkB/s    wkB/s avgrq-sz avgqu-sz   await r_await w_await  svctm  %util
nvme0n1           0.00    22.00 7854.00  185.00 39700.00  1276.00    10.19     3.35    0.52    0.51    0.89   0.12  97.20

avg-cpu:  %user   %nice %system %iowait  %steal   %idle
           6.91    0.00   11.44   53.99    0.00   27.66

Device:         rrqm/s   wrqm/s     r/s     w/s    rkB/s    wkB/s avgrq-sz avgqu-sz   await r_await w_await  svctm  %util
nvme0n1           0.00    34.00 9000.00 5135.00 43744.00 39672.00    11.80     8.00    0.63    0.53    0.79   0.07 100.00

avg-cpu:  %user   %nice %system %iowait  %steal   %idle
           9.61    0.00   11.17   52.21    0.00   27.01

Device:         rrqm/s   wrqm/s     r/s     w/s    rkB/s    wkB/s avgrq-sz avgqu-sz   await r_await w_await  svctm  %util
nvme0n1           0.00     0.00 9805.00    0.00 48452.00     0.00     9.88     4.09    0.50    0.50    0.00   0.10 100.00

avg-cpu:  %user   %nice %system %iowait  %steal   %idle
           7.59    0.00    8.35   29.11    0.00   54.94

Device:         rrqm/s   wrqm/s     r/s     w/s    rkB/s    wkB/s avgrq-sz avgqu-sz   await r_await w_await  svctm  %util
nvme0n1           0.00    30.00 4639.00 3658.00 24364.00 35492.00    14.43     4.56    0.64    0.48    0.84   0.09  74.00

avg-cpu:  %user   %nice %system %iowait  %steal   %idle
           7.12    0.00    9.16   41.98    0.00   41.73

Device:         rrqm/s   wrqm/s     r/s     w/s    rkB/s    wkB/s avgrq-sz avgqu-sz   await r_await w_await  svctm  %util
nvme0n1           0.00    27.00 7630.00 2359.00 38128.00 11220.00     9.88     5.06    0.59    0.52    0.80   0.10  98.00

avg-cpu:  %user   %nice %system %iowait  %steal   %idle
           2.30    0.00    4.60   25.83    0.00   67.26

Device:         rrqm/s   wrqm/s     r/s     w/s    rkB/s    wkB/s avgrq-sz avgqu-sz   await r_await w_await  svctm  %util
nvme0n1           0.00     5.00 3207.00  102.00 18368.00 18468.00    22.26     0.93    0.54    0.50    1.65   0.07  22.00

avg-cpu:  %user   %nice %system %iowait  %steal   %idle
           4.94    0.00    8.83   39.22    0.00   47.01

Device:         rrqm/s   wrqm/s     r/s     w/s    rkB/s    wkB/s avgrq-sz avgqu-sz   await r_await w_await  svctm  %util
nvme0n1           0.00     3.00 5951.00 4520.00 29964.00 18388.00     9.24     5.77    0.63    0.52    0.79   0.09  98.40

avg-cpu:  %user   %nice %system %iowait  %steal   %idle
           7.05    0.00    8.09   38.90    0.00   45.95

Device:         rrqm/s   wrqm/s     r/s     w/s    rkB/s    wkB/s avgrq-sz avgqu-sz   await r_await w_await  svctm  %util
nvme0n1           0.00    29.00 6731.00  270.00 33800.00  1892.00    10.20     2.84    0.52    0.52    0.70   0.11  79.20

avg-cpu:  %user   %nice %system %iowait  %steal   %idle
           3.76    0.00    4.76    9.77    0.00   81.70

Device:         rrqm/s   wrqm/s     r/s     w/s    rkB/s    wkB/s avgrq-sz avgqu-sz   await r_await w_await  svctm  %util
nvme0n1           0.00    36.00 1387.00 5032.00  8548.00 39196.00    14.88     3.74    0.72    0.47    0.79   0.04  26.00

avg-cpu:  %user   %nice %system %iowait  %steal   %idle
           2.02    0.00    2.77   21.41    0.00   73.80

Device:         rrqm/s   wrqm/s     r/s     w/s    rkB/s    wkB/s avgrq-sz avgqu-sz   await r_await w_await  svctm  %util
nvme0n1           0.00     0.00 1884.00    0.00 12176.00     0.00    12.93     0.01    0.49    0.49    0.00   0.00   0.80

avg-cpu:  %user   %nice %system %iowait  %steal   %idle
           7.44    0.00    7.18   29.74    0.26   55.38

Device:         rrqm/s   wrqm/s     r/s     w/s    rkB/s    wkB/s avgrq-sz avgqu-sz   await r_await w_await  svctm  %util
nvme0n1           0.00     8.00 3612.00 4942.00 18628.00 39088.00    13.49     4.95    0.68    0.54    0.77   0.07  61.20

avg-cpu:  %user   %nice %system %iowait  %steal   %idle
           5.76    0.00   10.73   51.05    0.00   32.46

Device:         rrqm/s   wrqm/s     r/s     w/s    rkB/s    wkB/s avgrq-sz avgqu-sz   await r_await w_await  svctm  %util
nvme0n1           0.00    22.00 9480.00  284.00 45992.00  1960.00     9.82     4.47    0.54    0.53    0.77   0.10 100.40

avg-cpu:  %user   %nice %system %iowait  %steal   %idle
           9.84    0.00   12.18   51.81    0.00   26.17

Device:         rrqm/s   wrqm/s     r/s     w/s    rkB/s    wkB/s avgrq-sz avgqu-sz   await r_await w_await  svctm  %util
nvme0n1           0.00    14.00 9273.00 4822.00 45748.00 38132.00    11.90     7.66    0.60    0.52    0.77   0.07  99.60

avg-cpu:  %user   %nice %system %iowait  %steal   %idle
           3.02    0.00    2.52   20.15    0.00   74.31

Device:         rrqm/s   wrqm/s     r/s     w/s    rkB/s    wkB/s avgrq-sz avgqu-sz   await r_await w_await  svctm  %util
nvme0n1           0.00    22.00 2022.00  308.00 12080.00  2008.00    12.09     0.31    0.53    0.48    0.83   0.03   6.00

avg-cpu:  %user   %nice %system %iowait  %steal   %idle
           3.84    0.00    6.14   14.32    0.00   75.70

Device:         rrqm/s   wrqm/s     r/s     w/s    rkB/s    wkB/s avgrq-sz avgqu-sz   await r_await w_await  svctm  %util
nvme0n1           0.00     7.00 1375.00 3916.00  8180.00 35036.00    16.34     3.11    0.74    0.49    0.83   0.04  20.40

avg-cpu:  %user   %nice %system %iowait  %steal   %idle
           5.87    0.00    6.38   33.67    0.00   54.08

Device:         rrqm/s   wrqm/s     r/s     w/s    rkB/s    wkB/s avgrq-sz avgqu-sz   await r_await w_await  svctm  %util
nvme0n1           0.00     2.00 6131.00 1026.00 31096.00  4136.00     9.85     3.24    0.57    0.53    0.85   0.13  95.60

^C
My rippled configure is:
[server]
port_rpc_admin_local
port_ws_admin_local
#port_ws_public

# port_peer
# port_ws_admin_local
# ssl_key = /etc/ssl/private/server.key
# ssl_cert = /etc/ssl/certs/server.crt

[port_rpc_admin_local]
port = 5005
ip = 127.0.0.1
admin = 127.0.0.1
protocol = http

[port_ws_public]
port = 8000
ip = 0.0.0.0
protocol = ws

# [port_peer]
# port = 51235
# ip = 0.0.0.0
# protocol = peer

[port_ws_admin_local]


[node_size]
#small
medium

# tiny
# small
# medium
# large
# huge

[node_db]
type=NuDB
path=/var/lib/rippled/db/nudb
advisory_delete=0

# How many ledgers do we want to keep (history)?
# Integer value that defines the number of ledgers
# between online deletion events
online_delete=200000

[ledger_history]
# How many ledgers do we want to keep (history)?
# Integer value (ledger count)
# or (if you have lots of TB SSD storage): 'full'
100000

[database_path]
/var/lib/rippled/db

[debug_logfile]
/var/log/rippled/debug.log

[sntp_servers]
time.windows.com
time.apple.com
time.nist.gov
pool.ntp.org

[ips]
r.ripple.com 51235

[validators_file]
validators.txt

[rpc_startup]
{ "command": "log_level", "severity": "info" }

# severity (order: lots of information .. only errors)
# debug
# info
# warn
# error
# fatal

[ssl_verify]
	...
What server_state command output is:
Loading: "/etc/opt/ripple/rippled.cfg"
2021-Aug-24 10:13:58.625540946 UTC HTTPClient:WRN Warning: No peer protocol configured
2021-Aug-24 10:13:58.625588838 UTC HTTPClient:NFO Connecting to 127.0.0.1:5005

{
   "result" : {
      "state" : {
         "build_version" : "1.7.2",
         "complete_ledgers" : "65876918-65877017,65877119-65877260",
         "io_latency_ms" : 1,
         "jq_trans_overflow" : "0",
         "last_close" : {
            "converge_time" : 3077,
            "proposers" : 41
         },
         "load" : {
            "job_types" : [
               {
                  "avg_time" : 269,
                  "job_type" : "ledgerRequest",
                  "peak_time" : 744,
                  "per_second" : 3,
                  "waiting" : 14
               },
               {
                  "avg_time" : 279,
                  "job_type" : "ledgerData",
                  "peak_time" : 3288,
                  "waiting" : 3
               },
               {
                  "avg_time" : 342,
                  "in_progress" : 4,
                  "job_type" : "clientCommand",
                  "peak_time" : 1657,
                  "per_second" : 6,
                  "waiting" : 6
               },
               {
                  "avg_time" : 103,
                  "in_progress" : 1,
                  "job_type" : "transaction",
                  "peak_time" : 841,
                  "per_second" : 13
               },
               {
                  "job_type" : "batch",
                  "peak_time" : 1,
                  "per_second" : 10
               },
               {
                  "avg_time" : 19,
                  "job_type" : "advanceLedger",
                  "peak_time" : 1680,
                  "per_second" : 8
               },
               {
                  "avg_time" : 37,
                  "job_type" : "fetchTxnData",
                  "peak_time" : 392,
                  "per_second" : 8
               },
               {
                  "in_progress" : 1,
                  "job_type" : "writeAhead"
               },
               {
                  "avg_time" : 164,
                  "job_type" : "trustedValidation",
                  "peak_time" : 935,
                  "per_second" : 7
               },
               {
                  "avg_time" : 109,
                  "job_type" : "trustedProposal",
                  "over_target" : true,
                  "peak_time" : 758,
                  "per_second" : 18
               },
               {
                  "avg_time" : 133,
                  "job_type" : "heartbeat",
                  "peak_time" : 199
               },
               {
                  "job_type" : "peerCommand",
                  "peak_time" : 1,
                  "per_second" : 1179
               },
               {
                  "job_type" : "processTransaction",
                  "per_second" : 13
               },
               {
                  "job_type" : "SyncReadNode",
                  "peak_time" : 2,
                  "per_second" : 78
               },
               {
                  "job_type" : "AsyncReadNode",
                  "peak_time" : 41,
                  "per_second" : 3279
               },
               {
                  "job_type" : "WriteNode",
                  "peak_time" : 14,
                  "per_second" : 197
               }
            ],
            "threads" : 6
         },
         "load_base" : 256,
         "load_factor" : 256000000,
         "load_factor_fee_escalation" : 256,
         "load_factor_fee_queue" : 256,
         "load_factor_fee_reference" : 256,
         "load_factor_server" : 256000000,
         "peer_disconnects" : "0",
         "peer_disconnects_resources" : "0",
         "peers" : 21,
        ...
Any ideas?
Can you also execute server_info and post the results? Also, what kind of SSD is this? I am assuming EBS, but is it io1, io2, gp2 or gp3?
Thank for your time.
It is io1 type SSD:
There is a partial output of server_state command in first post, it is exactly the status when gap happen.
Since I have reboot the rippled server, so the server_info output bellow just reflect the normal status.
sudo docker exec -it 31 rippled server_info
Loading: "/etc/opt/ripple/rippled.cfg"
2021-Aug-26 00:07:56.884747922 UTC HTTPClient:WRN Warning: No peer protocol configured
2021-Aug-26 00:07:56.884804343 UTC HTTPClient:NFO Connecting to 127.0.0.1:5005

{
   "result" : {
      "info" : {
         "build_version" : "1.7.2",
         "complete_ledgers" : "65676002-65913098",
         "hostid" : "31447bf5c244",
         "io_latency_ms" : 1,
         "jq_trans_overflow" : "0",
         "last_close" : {
            "converge_time_s" : 3.001,
            "proposers" : 41
         },
         "load" : {
            "job_types" : [
               {
                  "job_type" : "untrustedValidation",
                  "per_second" : 24
               },
               {
                  "avg_time" : 6,
                  "job_type" : "ledgerRequest",
                  "peak_time" : 405,
                  "per_second" : 12
               },
               {
                  "job_type" : "untrustedProposal",
                  "per_second" : 13
               },
               {
                  "in_progress" : 2,
                  "job_type" : "ledgerData",
                  "peak_time" : 9,
                  "waiting" : 1
               },
               {
                  "in_progress" : 1,
                  "job_type" : "clientCommand",
                  "peak_time" : 24,
                  "per_second" : 34
               },
               {
                  "job_type" : "transaction",
                  "per_second" : 12
               },
               {
                  "job_type" : "batch",
                  "peak_time" : 1,
                  "per_second" : 11
               },
               {
                  "job_type" : "advanceLedger",
                  "peak_time" : 19,
                  "per_second" : 4
               },
               {
                  "job_type" : "fetchTxnData",
                  "per_second" : 5
               },
               {
                  "job_type" : "trustedValidation",
                  "peak_time" : 2,
                  "per_second" : 8
               },
               {
                  "in_progress" : 1,
                  "job_type" : "acceptLedger"
               },
               {
                  "job_type" : "trustedProposal",
                  "per_second" : 18
               },
               {
                  "avg_time" : 2,
                  "job_type" : "heartbeat",
                  "peak_time" : 5
               },
               {
                  "job_type" : "peerCommand",
                  "peak_time" : 2,
                  "per_second" : 1323
               },
               {
                  "job_type" : "processTransaction",
                  "per_second" : 12
               },
               {
                  "job_type" : "SyncReadNode",
                  "peak_time" : 39,
                  "per_second" : 359
               },
               {
                  "job_type" : "AsyncReadNode",
                  "peak_time" : 2,
                  "per_second" : 1735
               },
               {
                  "job_type" : "WriteNode",
                  "peak_time" : 1,
                  "per_second" : 435
               }
            ],
            "threads" : 6
         },
         "load_factor" : 1,
         "peer_disconnects" : "1",
         "peer_disconnects_resources" : "0",
         "peers" : 21,
         "pubkey_node" : "n9MTg18H5uLJTG2P3P62nDMHkNjDm9BjbGqy12ZiCcP9RpwkTWsd",
         "pubkey_validator" : "none",
         "server_state" : "full",
         "server_state_duration_us" : "135747619612",
         "state_accounting" : {
            "connected" : {
               "duration_us" : "234430924",
               "transitions" : 2
            },
            "disconnected" : {
               "duration_us" : "1140696",
               "transitions" : 2
            },
            "full" : {
               "duration_us" : "135747619612",
               "transitions" : 1
            },
            "syncing" : {
               "duration_us" : "4099507",
               "transitions" : 1
            },
            "tracking" : {
               "duration_us" : "40",
               "transitions" : 1
            }
         },
         "time" : "2021-Aug-26 00:07:56.886485 UTC",
         "uptime" : 135987,
         "validated_ledger" : {
            "age" : 3,
            "base_fee_xrp" : 1e-05,
            "hash" : "54890F2B2BADDCEC5B16E3E8C0FEB8B88D4C86478D396CAE7D59AAFECF0C90AA",
            "reserve_base_xrp" : 20,
            "reserve_inc_xrp" : 5,
            "seq" : 65913098
         },
         "validation_quorum" : 33,
         "validator_list" : {
            "count" : 1,
            "expiration" : "2022-Jan-11 00:00:00.000000000 UTC",
            "status" : "active"
         }
      },
      "status" : "success"
   }
}