vmstorage: could we have a more flexible lsm parts limit.
Is your feature request related to a problem? Please describe.

We find the total lsm parts opened by vmstorage increased by a significant percentage on each 1st of a month. It could reduce the database stability.
One reason we guess is that the old partition stoped ingesting new parts and the merge speed became slower. So the base number of parts would continues increasing.
Since you set a hard limit for the database, if the part increased more than this limit the so called assisted merge will happen. So after several month the buffer for assisted merge would become small and small. https://github.com/VictoriaMetrics/VictoriaMetrics/blob/343241680bde1227d67db1bc016211f46bd91ec1/lib/mergeset/table.go#L27
Could give different part limit for the last N month partitions as hot data and the older partitions as cold data? So we limit parts number for last N month, the db will merge them in a high frequency with more cpu to reduce the read amplification for the most recent data. And then we give a larger limit for older months and current month, we use a lower resource (less goroutine) to merge them. so db will have a controllable number of parts in global.
Hi @eddietanshuo ! This spikes doesn't depends on maxParts const. Because mergset process mostly is used for retention period. When it come mergset starts to merge tmeserises. But at the end of month vm creates partitions and starts the merge process.
@valyala Can you please share more information about merge process, please
Thanks for reply @dmitryk-dk.
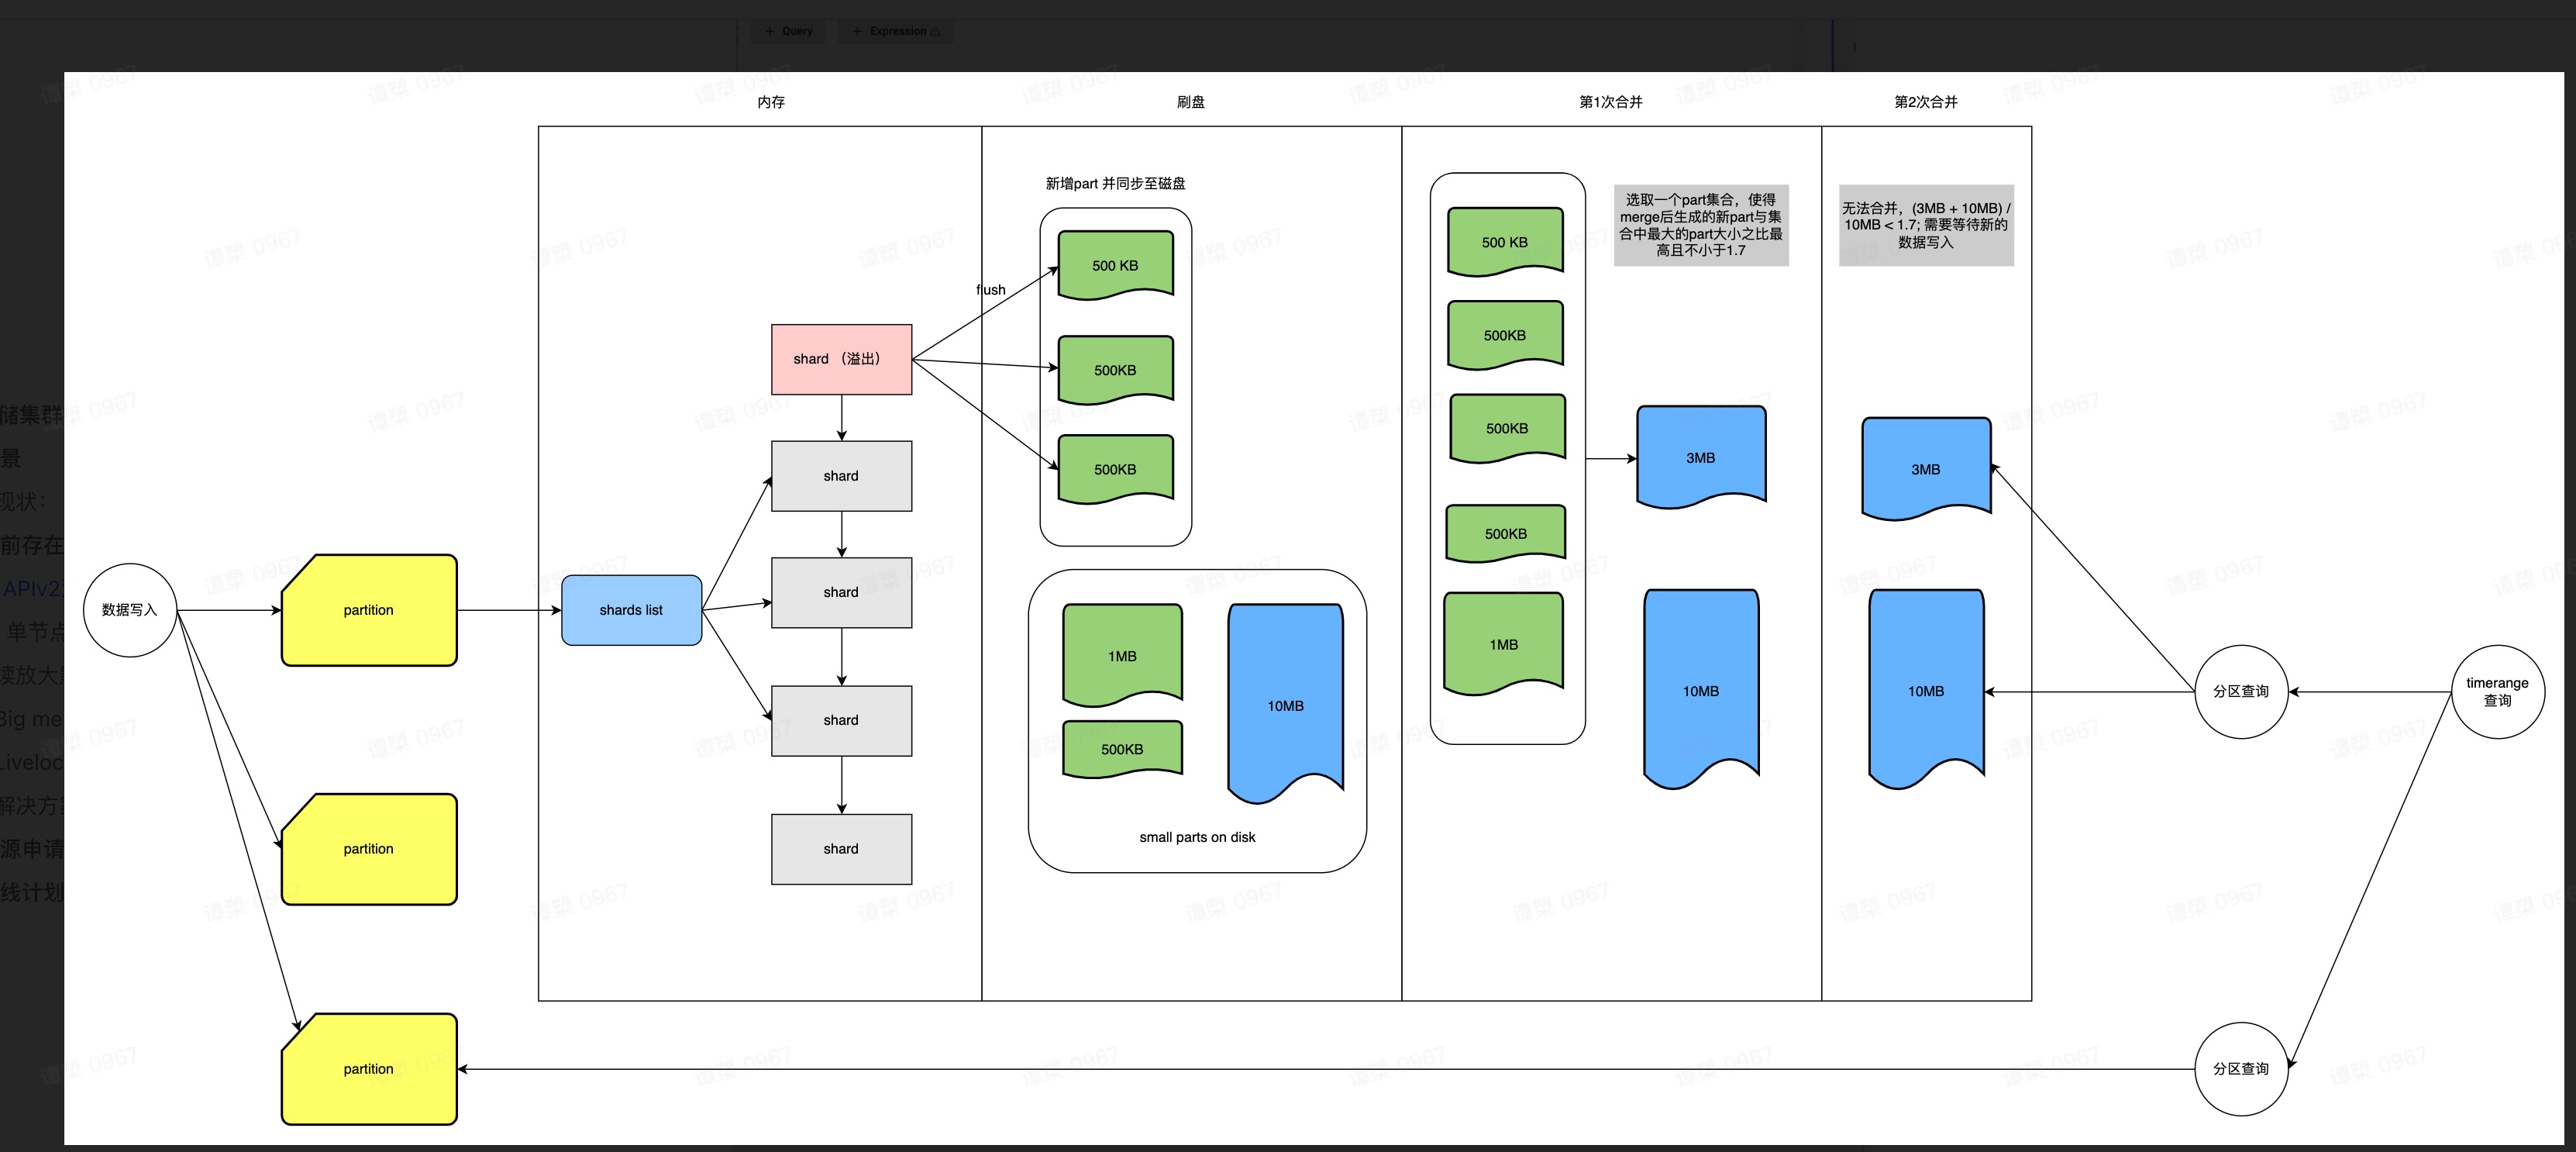
I just read the source code and draw a picture to help myself to understand the merge process. It's true the assisted merge do not depend on the limit. Each partition has its own limit.
The phenomenon is at some period of a month(always the first week), the cluster will occasionally face the assisted merge issue: https://github.com/VictoriaMetrics/VictoriaMetrics/issues/2552.
We have 12 servers which have:
- CPU: 64
- Memory: 256
- Disk 20T HDD raid0
Our data:
- active timeseries: 600M
- data ingesting rate 7M/s
- slow query rate 0.4%
- slow insert rate 0.03%
- churn rate 24h 200M
It's stable in common case, however sometimes assisted merge will happen on a single node. Today we face a vmstorage node restarted (at 11:00am).
tcp connections before assisted merge happen
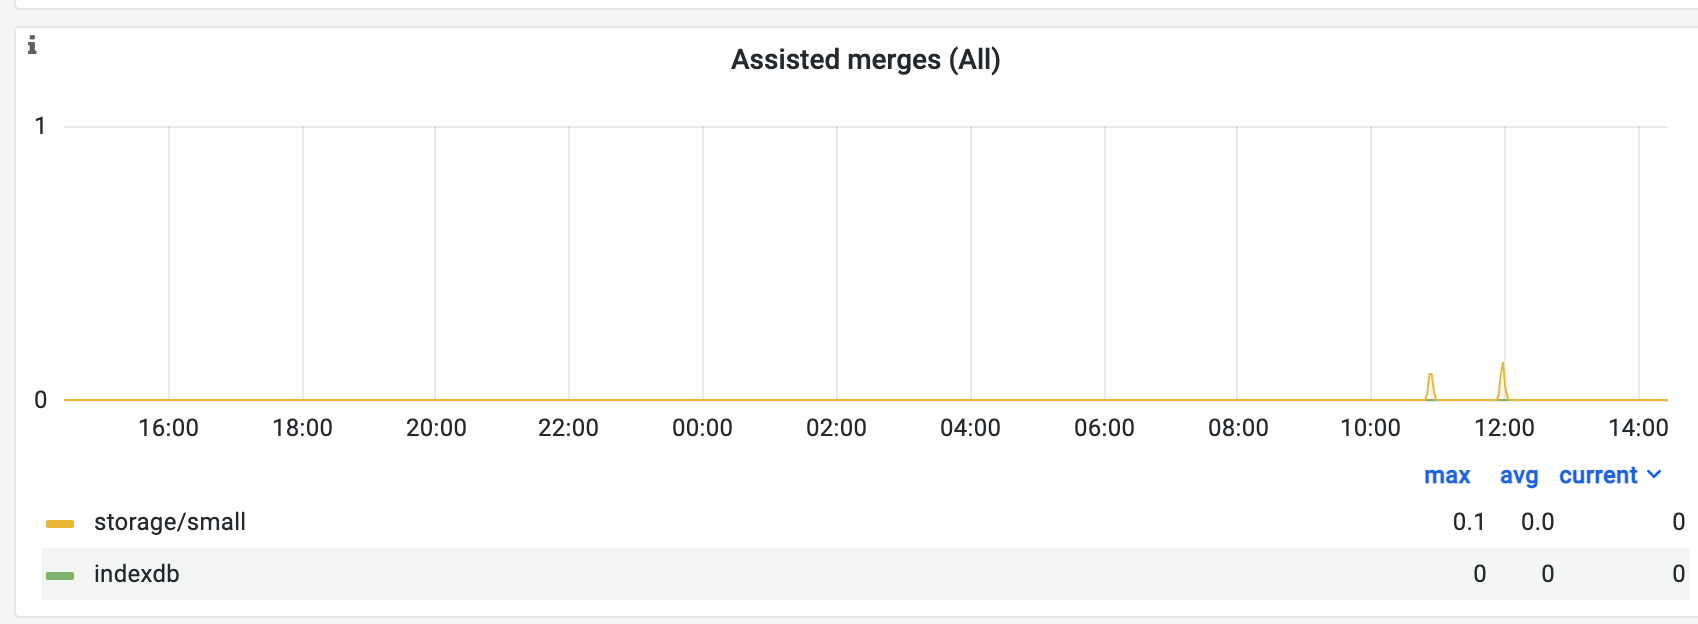
assisted merge
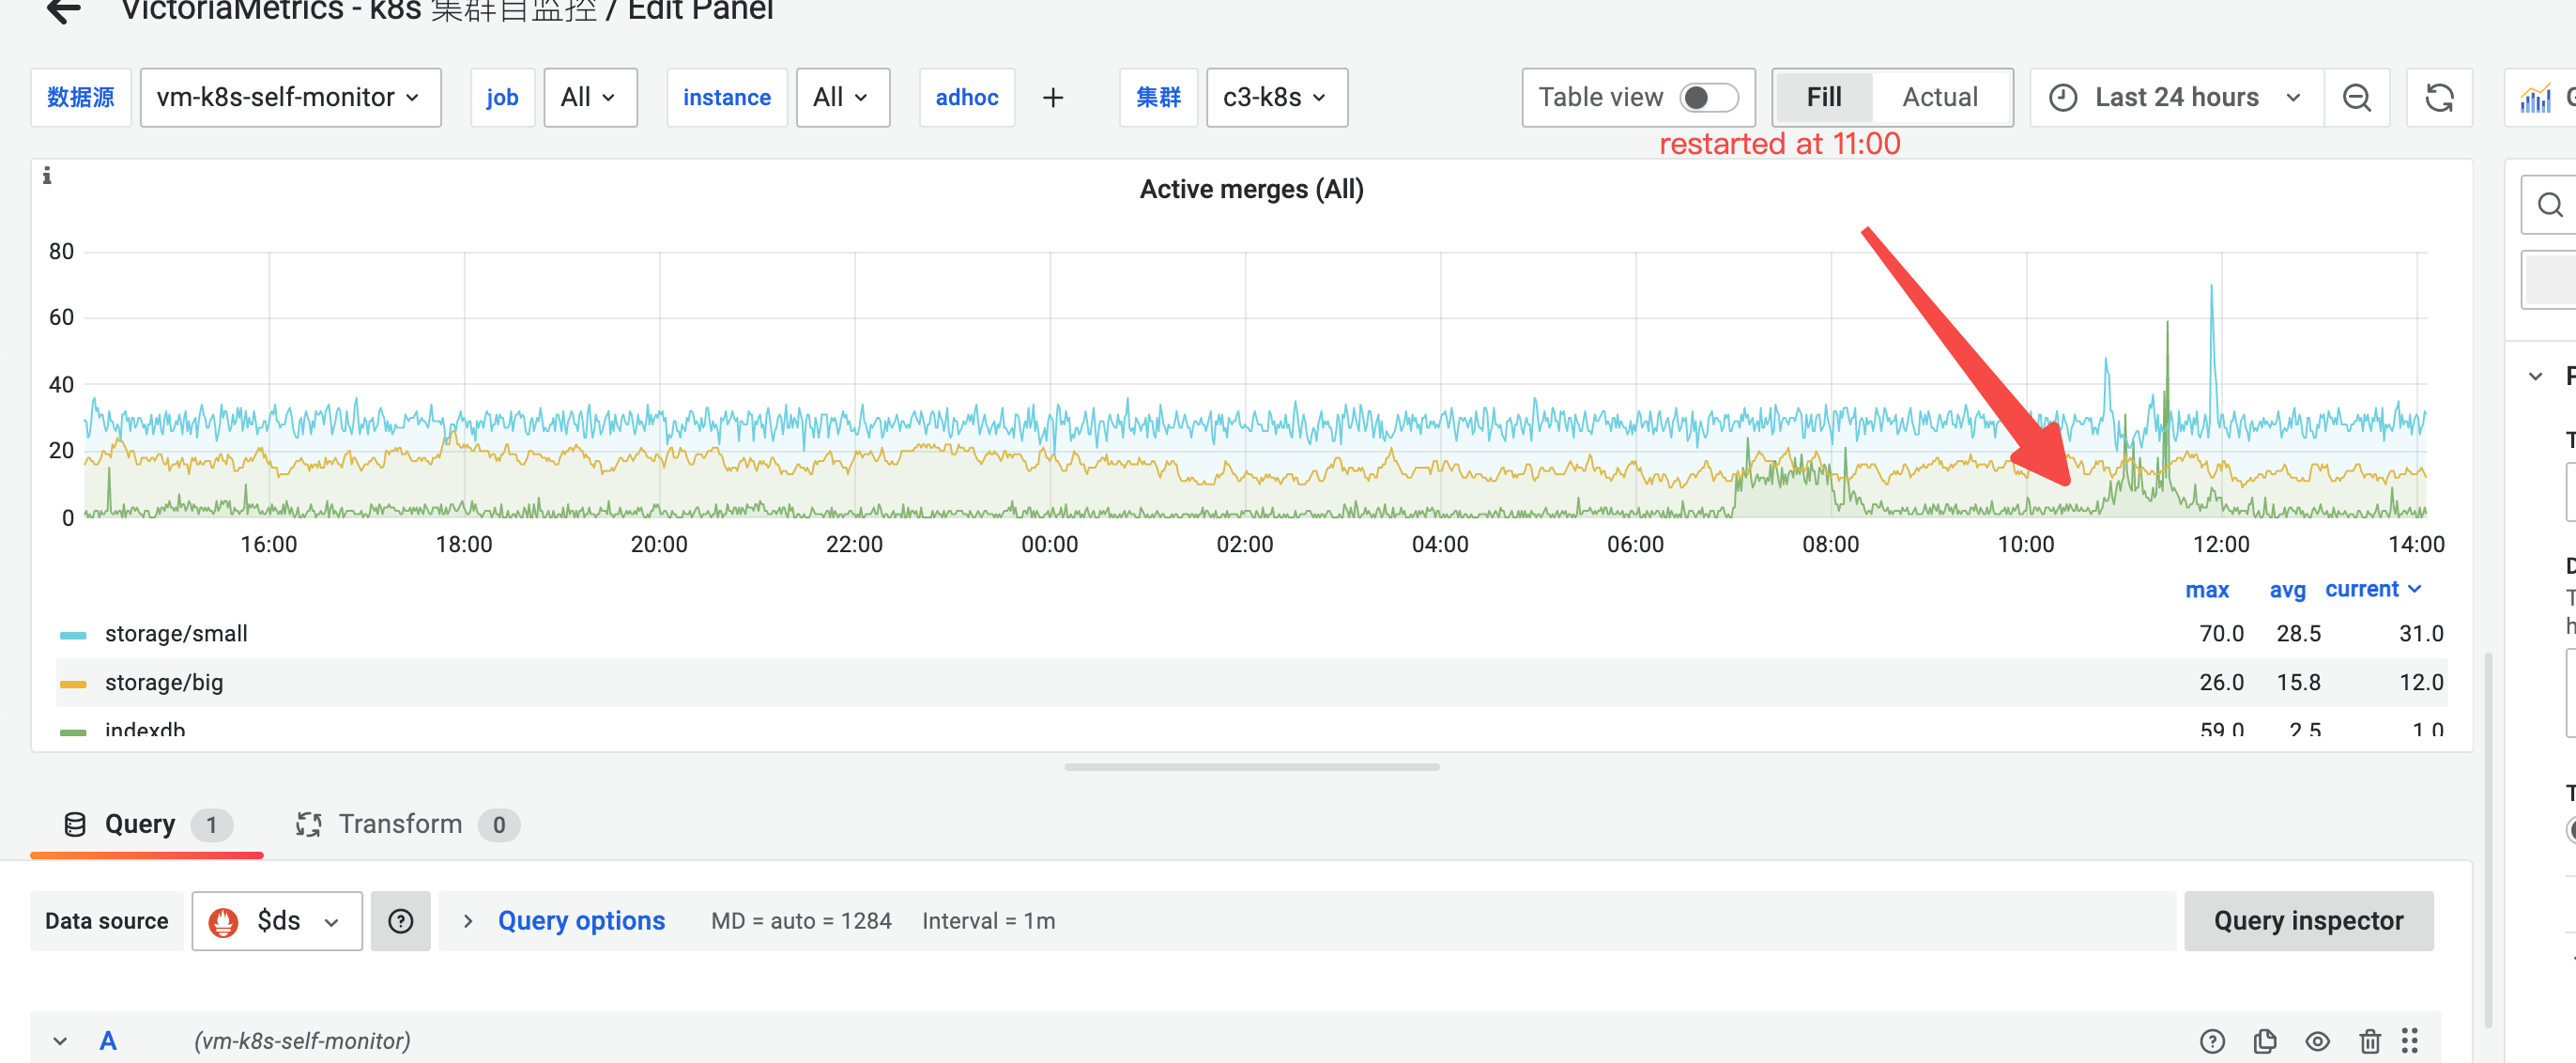
active merge before assisted merge happen
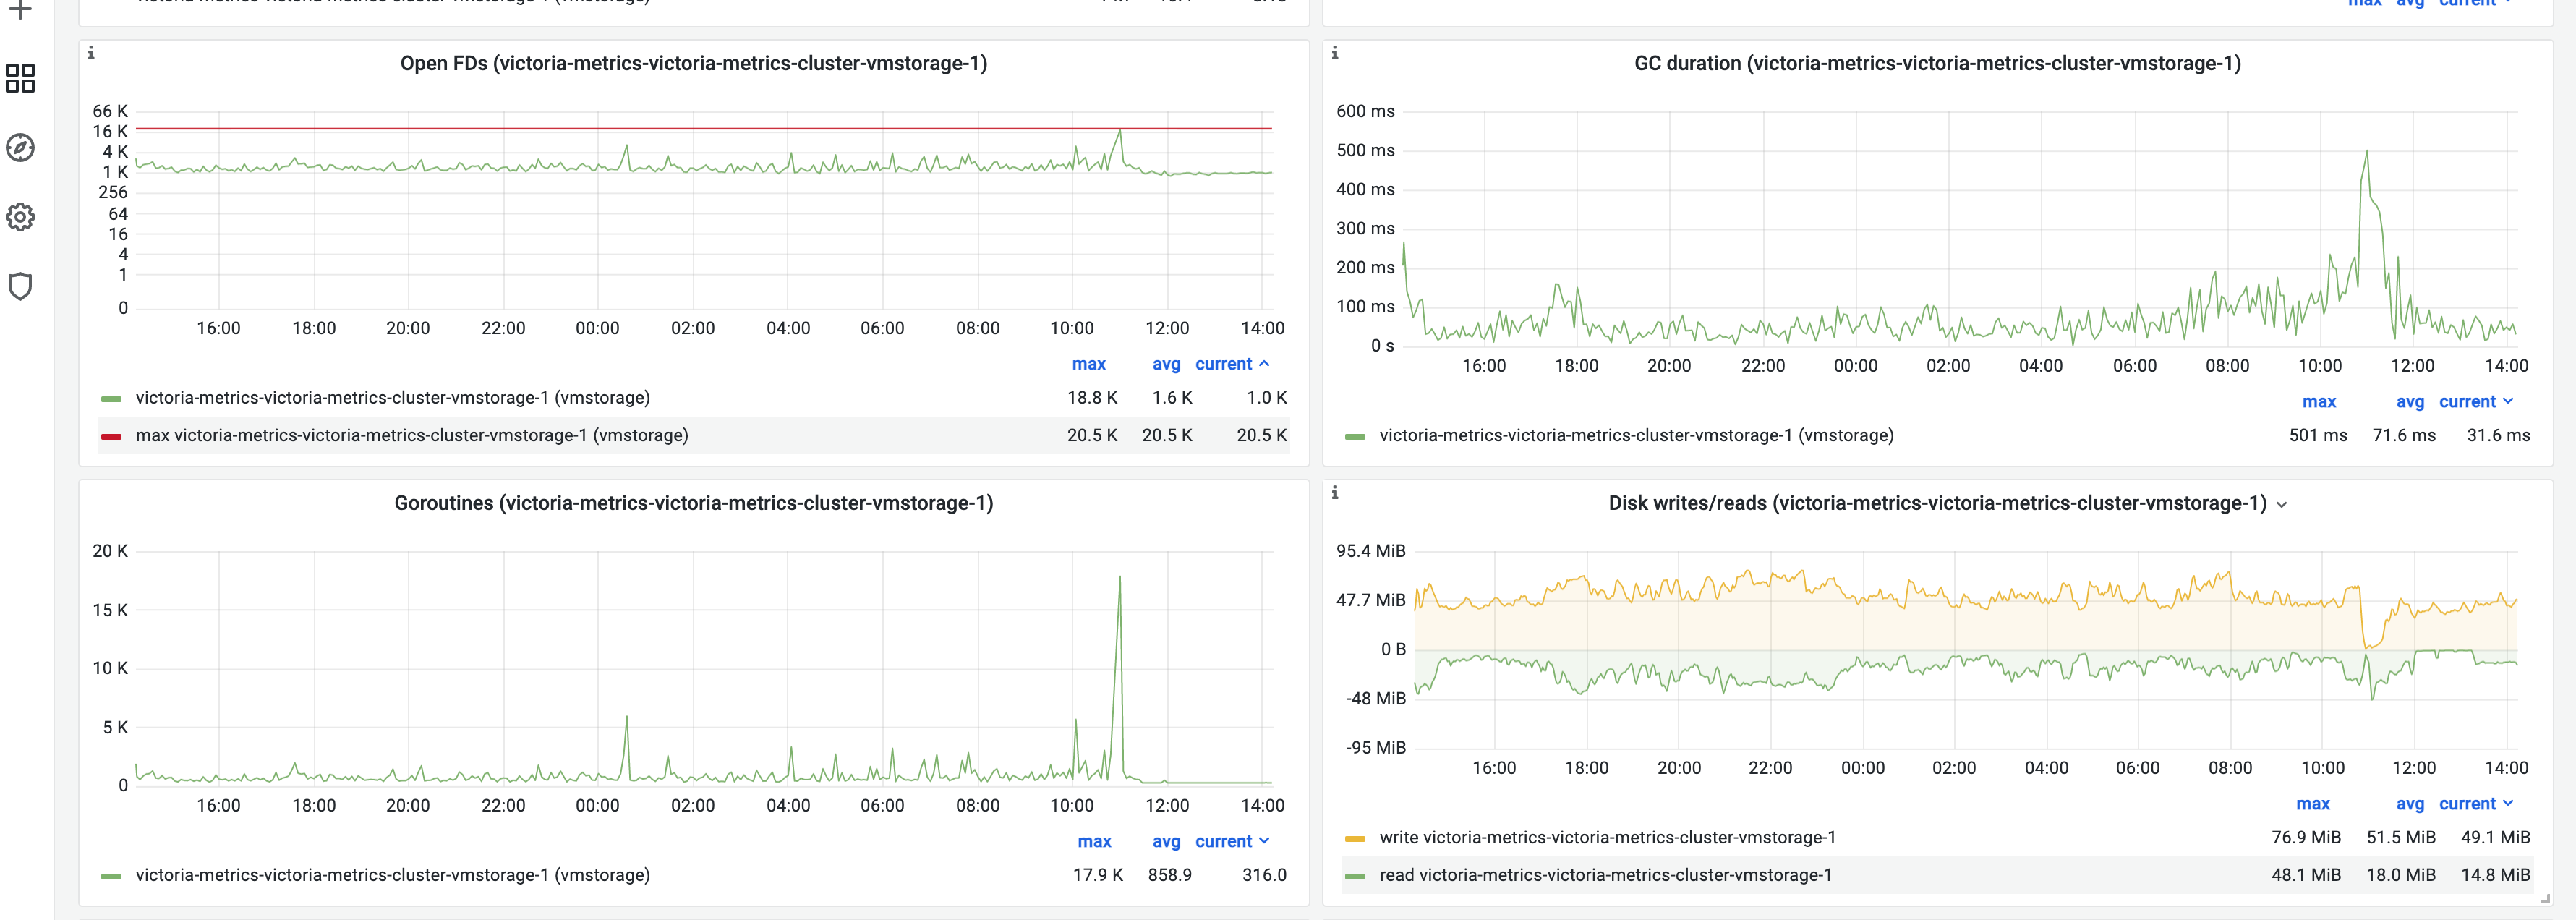
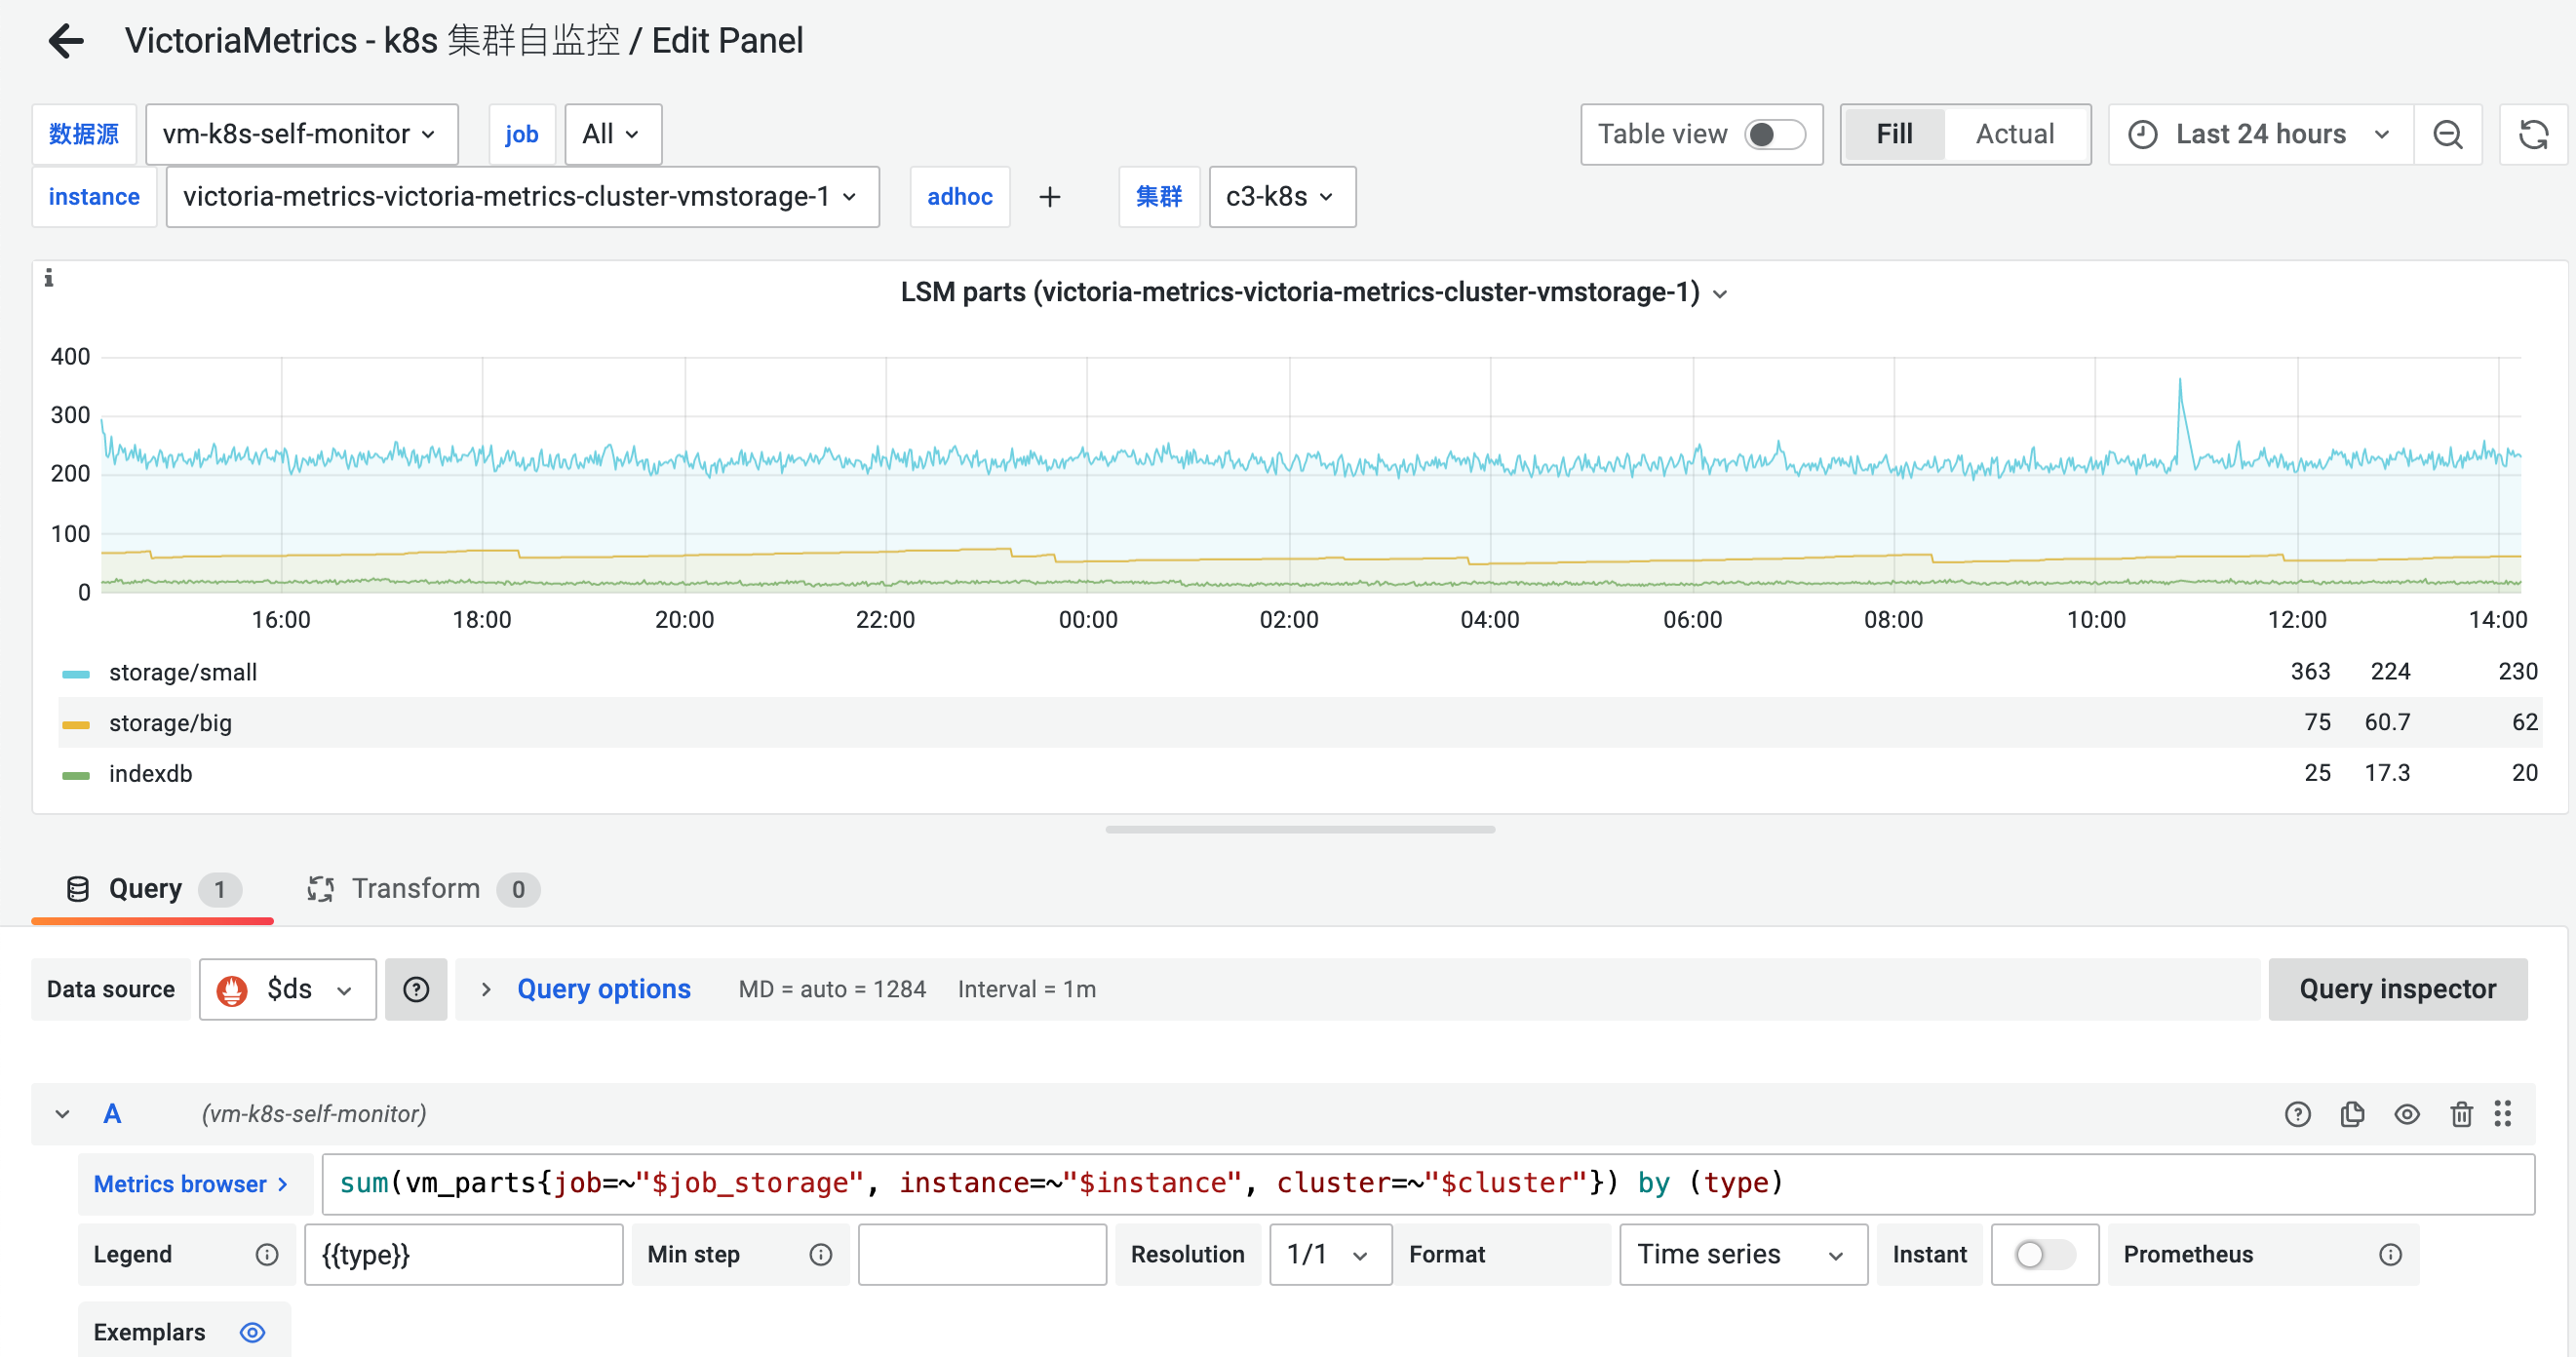
LSM parts before assisted merge happen
tcp connections

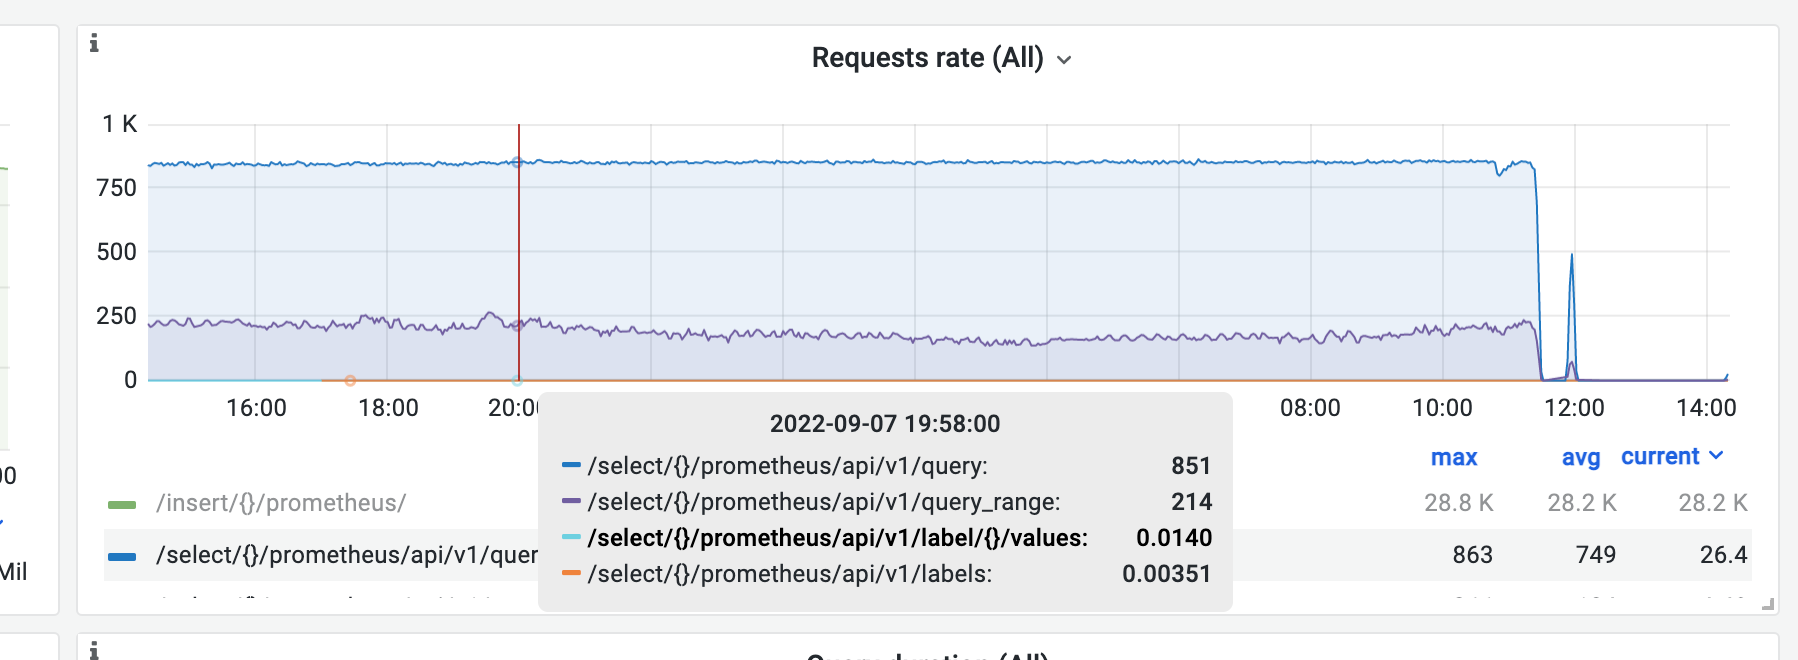
request rate
log output
FATAL: cannot determine free disk space on \"/storage/indexdb/16DC897273F79020\": open /storage/indexdb/16DC897273F79020: too many open files
HI @eddietanshuo ! This error can happen when your empty disk size is lower than 20% of whole storage. If free disk space is lower than 20%, then VictoriaMetrics is unable to perform optimal background merge of the incoming data. This leads to increased number of data files on disk, which, in turn, slows down both data ingestion and querying. See these docs for details. I think that is why you got this error. Also VictoriaMetrics provide dashboards where you can check file descriptors https://grafana.com/grafana/dashboards/11176-victoriametrics-cluster/ And some simple understanding how storage works you can find here https://docs.victoriametrics.com/#storage
@dmitryk-dk Hi, I encountered a problem where vmagent persistent queue accumulates when the vmstroage disk free space is below 20%. I'm wondering why is it 20%? Are there any parameters to be tuned, or is there any code reference?
Hi @just1900 ! You should have at least 20% of the free disk space because vmstorage uses background merge processes. VictoriaMetrics doesn't merge parts if their summary size exceeds free disk space. This prevents from potential out of disk space errors during merge. The number of parts may significantly increase over time under free disk space shortage. This increases overhead during data querying, since VictoriaMetrics needs to read data from bigger number of parts per each request. That's why it is recommended to have at least 20% of free disk space under directory pointed by -storageDataPath command-line flag. You can define your own free disk space usage via flag
-storage.minFreeDiskSpaceBytes size
     The minimum free disk space at -storageDataPath after which the storage stops accepting new data
     Supports the following optional suffixes for size values: KB, MB, GB, TB, KiB, MiB, GiB, TiB (default 10000000)
@dmitryk-dk Thanks for your explaination.
-storage.minFreeDiskSpaceBytes size The minimum free disk space at -storageDataPath after which the storage stops accepting new data
AFAIK, this parameter is used for protecting the volume being full. If the disk free space is lower than minFreeDiskSpaceBytes, victoriametrics turns into read-only mode.
VictoriaMetrics doesn't merge parts if their summary size exceeds free disk space.
By this, do you mean that if the parts is larger than free disk we can not perform merge for those parts as the code here?
I'm confused about the 20%, is this hard-coded limit? In my case, the vmstorage node is performing an time-consuming index merge and lasts about 2hours, and vmagent sends packets normally but accumulates them when disk space usage exceeds 80%.(~7:00 shown in the panel).
- disk usage
- LSM parts
- Vmagent persistent queue
There are no constant limits. 20% is just a recommendation. But if the free disk space is lower than 20%, you can see some performance degradation. Please, check this comment.
@dmitryk-dk I got it. I thought it would trigger the write limit or something before. Then could you provide guidance on how to analyze the issue and determine what is causing the persistent queue growth?
First, you should check vminsert, vmstorage, and vmagent logs. There should be helpful information about what cause the persistent queue growth. If it is possible you can share some logs here