Process memory balloons on create/close of multiple environments
This is an odd one I have a script where I am creating and closing many environments in a single process. The memory balloons progressively the more iterations the code executes. You will see from the code the environments are being closed, I have also verified the process has no open files related to the mdb files after all iterations complete. This came up as we are seeing this on a smaller scale where users are creating/dropping environments without restarting our product.
Thank you for your help.
'use strict';

const fs = require('fs');
const path = require('path');
const lmdb = require('node-lmdb');
const {promisify} = require('util');
const p_sleep = promisify(setTimeout);

function createEnv(name){
    let environment_path = path.join(__dirname, 'data', name);
    try {
        fs.rmdirSync(environment_path, {recursive:true})
        fs.mkdirSync(environment_path);
    }catch(e){
        console.error(e);
    }
    let env_init = {
        "path": environment_path,
        "mapSize": 10*1024*1024,
        "maxReaders": 1000
    };
    let env = new lmdb.Env();
    env.open(env_init);

    return env;
}

async function run(seed){
    const prefix = seed + 'env';
    await p_sleep(1000);
let es = [];
    for(let x = 0; x < 1000; x++){
        es.push(createEnv(prefix + x));
    }
    console.log('added');
    await p_sleep(1000);

    for(let x = 0; x < 1000; x++){
        es[x].close();
    }
    console.log('deleted');
    await p_sleep(1000);

    es = [];
}

(async ()=>{
    await p_sleep(5000);
    await run(1);
    await run(2);
    await run(3);
    await run(4);
    await run(5);

    setInterval(()=>{}, 1000);
})();
I have tried running this script on Windows and OSX and haven't seen any type of unusual memory growth. How much memory growth are you seeing? Do you know what type of memory is growing (shared vs private, if private, V8 heap vs external)?
Hi Kris,
I'll get as much info together for you this morning as I can to start from my Ubuntu VM & from Windows. On Ubuntu I am seeing initially small growth per execution that then leaps unexpectedly roughly: 30Mb, 180Mb, 1 Gb, 2Gb. I will post in a bit with more concrete data for you.
I updated my script to output memory used by the process:
'use strict';

const fs = require('fs');
const path = require('path');
const lmdb = require('node-lmdb');
const {promisify} = require('util');
const p_sleep = promisify(setTimeout);

function createEnv(name){
    let environment_path = path.join(__dirname, 'data', name);
    try {
        fs.rmdirSync(environment_path, {recursive:true})
        fs.mkdirSync(environment_path);
    }catch(e){
        console.error(e);
    }
    let env_init = {
        "path": environment_path,
        "mapSize": 10*1024*1024,
        "maxReaders": 1000
    };
    let env = new lmdb.Env();
    env.open(env_init);

    return env;
}

async function run(seed){
    const prefix = seed + 'env';
    await p_sleep(1000);
    let es = [];
    for(let x = 0; x < 1000; x++){
        es.push(createEnv(prefix + x));
    }
    console.log(`added ${seed}`);
    console.log(process.memoryUsage());
    await p_sleep(1000);

    for(let x = 0; x < 1000; x++){
        es[x].close();
    }
    es = [];
    console.log(`deleted ${seed}`);
    console.log(process.memoryUsage());
}

(async ()=>{
    await p_sleep(5000);
    await run(1);
    await run(2);
    await run(3);
    await run(4);
    await run(5);

    setInterval(()=>{}, 1000);
})();
as you stated Windows is managing memory as expected, growing some with adds, shrinking with closes. here is my output:
added 1
{
  rss: 41762816,
  heapTotal: 6533120,
  heapUsed: 4193136,
  external: 1015341,
  arrayBuffers: 9382
}
deleted 1
{
  rss: 25882624,
  heapTotal: 6533120,
  heapUsed: 4237704,
  external: 1015381,
  arrayBuffers: 9382
}
added 2
{
  rss: 42250240,
  heapTotal: 6270976,
  heapUsed: 2703288,
  external: 1007117,
  arrayBuffers: 9382
}
deleted 2
{
  rss: 25391104,
  heapTotal: 6270976,
  heapUsed: 2722272,
  external: 1007117,
  arrayBuffers: 9382
}
added 3
{
  rss: 42139648,
  heapTotal: 6270976,
  heapUsed: 3487416,
  external: 1007117,
  arrayBuffers: 9382
}
deleted 3
{
  rss: 25575424,
  heapTotal: 6270976,
  heapUsed: 3498360,
  external: 1007117,
  arrayBuffers: 9382
}
added 4
{
  rss: 42659840,
  heapTotal: 6270976,
  heapUsed: 3183840,
  external: 1007117,
  arrayBuffers: 9382
}
deleted 4
{
  rss: 26402816,
  heapTotal: 6270976,
  heapUsed: 3193800,
  external: 1007117,
  arrayBuffers: 9382
}
added 5
{
  rss: 42786816,
  heapTotal: 6270976,
  heapUsed: 3875032,
  external: 1007117,
  arrayBuffers: 9382
}
deleted 5
{
  rss: 26173440,
  heapTotal: 6270976,
  heapUsed: 3884096,
  external: 1007117,
  arrayBuffers: 9382
}
On Ubuntu 18 the memory keeps growing dramatically:
added 1
{
  rss: 56098816,
  heapTotal: 6533120,
  heapUsed: 3920176,
  external: 1018216,
  arrayBuffers: 34794
}
deleted 1
{
  rss: 44167168,
  heapTotal: 6533120,
  heapUsed: 3965096,
  external: 1018256,
  arrayBuffers: 34794
}
added 2
{
  rss: 192237568,
  heapTotal: 6533120,
  heapUsed: 3656952,
  external: 1001264,
  arrayBuffers: 17802
}
deleted 2
{
  rss: 44851200,
  heapTotal: 6533120,
  heapUsed: 3670560,
  external: 1001264,
  arrayBuffers: 17802
}
added 3
{
  rss: 193470464,
  heapTotal: 6533120,
  heapUsed: 4100200,
  external: 1010032,
  arrayBuffers: 26570
}
deleted 3
{
  rss: 147570688,
  heapTotal: 6533120,
  heapUsed: 4111488,
  external: 1010032,
  arrayBuffers: 26570
}
added 4
{
  rss: 1599483904,
  heapTotal: 6533120,
  heapUsed: 4305736,
  external: 1010256,
  arrayBuffers: 26794
}
deleted 4
{
  rss: 1553395712,
  heapTotal: 6533120,
  heapUsed: 4315784,
  external: 1010256,
  arrayBuffers: 26794
}
added 5
{
  rss: 2189725696,
  heapTotal: 6795264,
  heapUsed: 4423208,
  external: 1018560,
  arrayBuffers: 35098
}
deleted 5
{
  rss: 2143694848,
  heapTotal: 6795264,
  heapUsed: 4432816,
  external: 1018560,
  arrayBuffers: 35098
}
Do you know how to determine how much of that is shared memory (I don't know how to do that for sure in Ubuntu)? Shared memory reporting can be rather tricky/misleading, since shared memory doesn't necessarily represent any real extra memory consumption by your process, but rather just the OS attributing memory in the OS cache to one of your processes (since you have get a pointer to the OS cache with memory maps).
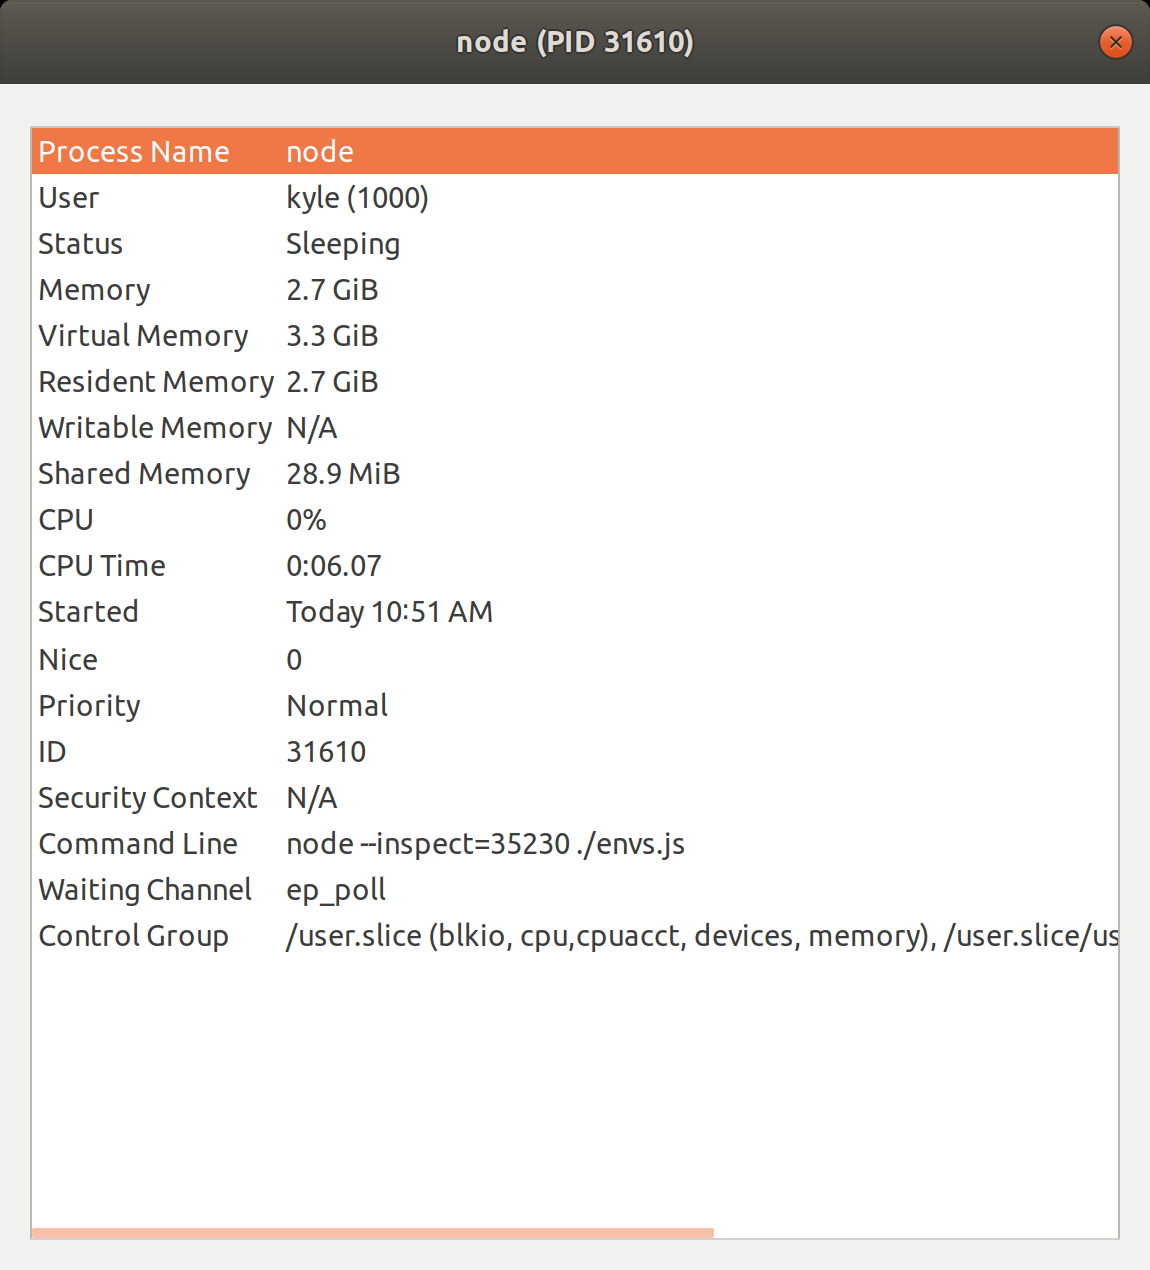
I'm not sure about inspecting shared memory either and am working on seeing if I can get some insight. Here is a screenshot of the process properties after it ran the open/close 5 times. It shows the shared memory as quite low.
I have also run a heap timeline using Chrome devtools, nothing stands out to me there. Heap-20201210T105157.zip
I am going to run on Ubuntu 20.04 in the off chance this is an OS issue. We are running on EXT4, do you feel a different file system would offer a difference?
Does this problem exist in [email protected] or 0.9.2? Just wondering if it is possible that there is a bug in the code that tries to check if any other threads are using an env before closing.
i still see the memory expanding, just not quite as much. Where in the most recent release it will expand to over 2 Gb, 0.9.2 & 0.9.3 both go to around 1.5 Gb.
added 1
{
  rss: 56025088,
  heapTotal: 6533120,
  heapUsed: 3834576,
  external: 1002197,
  arrayBuffers: 26474
}
deleted 1
{
  rss: 43941888,
  heapTotal: 6533120,
  heapUsed: 3879520,
  external: 1002237,
  arrayBuffers: 26474
}
added 2
{
  rss: 192557056,
  heapTotal: 6795264,
  heapUsed: 4510320,
  external: 1019709,
  arrayBuffers: 43946
}
deleted 2
{
  rss: 44969984,
  heapTotal: 6795264,
  heapUsed: 4522096,
  external: 1019709,
  arrayBuffers: 43946
}
added 3
{
  rss: 193318912,
  heapTotal: 6795264,
  heapUsed: 3838960,
  external: 1001901,
  arrayBuffers: 26138
}
deleted 3
{
  rss: 146804736,
  heapTotal: 6795264,
  heapUsed: 3850248,
  external: 1001901,
  arrayBuffers: 26138
}
added 4
{
  rss: 1597091840,
  heapTotal: 6795264,
  heapUsed: 3938160,
  external: 993709,
  arrayBuffers: 17946
}
deleted 4
{
  rss: 1551060992,
  heapTotal: 6795264,
  heapUsed: 3948208,
  external: 993709,
  arrayBuffers: 17946
}
added 5
{
  rss: 1629421568,
  heapTotal: 6795264,
  heapUsed: 3945904,
  external: 1001805,
  arrayBuffers: 26042
}
deleted 5
{
  rss: 1583370240,
  heapTotal: 6795264,
  heapUsed: 3955488,
  external: 1001805,
  arrayBuffers: 26042
}
We can spin up an ubuntu instance & give you access if that would be helpful.
I could try looking at an ubuntu instance.
I did try to see what memory usage looks like if I intentionally do not close any of the envs in your test case. In that case, it looks like 5,000 open envs takes about 100MB (about 20KB per env) or private application memory. This is nowhere close to the 1.5-2GB memory consumption you are seeing, which leads me to believe the what you are seeing is likely due to the memory maps. And again, if this is the case, memory-mapped memory isn't actually application consumed memory, it is not "taking" it from anywhere else, it is just getting pointers to OS (file-cache) memory. I am not sure why Ubuntu process properties doesn't report that as shared memory though (maybe it only considers it "shared" if more than one process is accessing it?). I suppose the ultimate test of memory consumption is see if it is actually taking the resident/RAM memory from other processes. If this isn't taking any memory from other processes, than there isn't really any physical memory being consumed or re-appropriated, regardless of how the OS reports that memory. Of course that is a more difficult to actually test.
I would've thought that closing an env would also release the memory map, is that not the case?
Yes, it is the case, and I've debugged/stepped through the code to verify that munmap is called when env.close() is called.
And that's why I still suspect this has to do with differing definitions and reporting of memory. "Using" memory for the JS heap means something entirely different than "using" memory for a memory map (which is literally mapping address space to a disk instead of physical memory), and actual physical memory usage involved when interacting with memory map can be dependent on many factors beyond the application itself.
But that is just my guess, since I can't reproduce this memory growth with this test case on Windows or macOS.
We will get you access to an Ubuntu instance on Monday morning to help with debugging the issue. If there is anything else you will need please let us know.
I am going to update my script to use cluster and see if that impacts shared process memory.
I have verified after script run that none of the mdb files are referenced by the process.
I will DM tomorrow AM with details for the EC2 instance.
Thanks again for your help & insight!
@kriszyp I emailed you directly with the Ubuntu instances information.
I don't have any exact answer or solution, but here are some things I noticed:
Paradoxically, the ballooning memory usage does not occur if you do not close the environments. There is, of course, some memory consumption/growth that occurs since the env's are not freed (about 15Kb per env, roughly what I suggested above), plus some shared memory usage probably due to some read-aheads on the memory maps, but nothing anywhere close to the massive memory consumption (and paging) that suddenly occurs when opening envs after closing 3000 of them (seems like a couple orders of magnitude more).
As far as I can tell, this doesn't seem to be dependent on the map size, or the amount of memory virtually allocated. The behavior seems the same whether using 10Mb or 1Mb memory maps, the contents of the memory map doesn't seem to be consuming any memory, other than a small bit of read-ahead memory usage. This shared memory from the memory maps actually goes down once the memory consumption starts exploding, presumably because it is paging out the shared memory.
I don't think the asynchronicity has anything to do with this.
The ballooning memory consumption does not seem to appear when opening the envs in read-only mode.
Anyway, again, I don't know what is happening. My best guess is that there is some type of internal linux mechanism for tracking dirty memory maps and part of the reclamation of virtual address space potentially involves checking previously discarded memory maps (and perhaps don't some type of scan of address space that is triggering touching memory pages).
In terms of mitigation, is it feasible to just not close environments? Presumably there is a finite number of potential env files on one server? FWIW, the (private) memory used by an LMDB env for config is actually probably more amenable to being swapped out of RSS than typical JS heap memory that is constantly thrashed by copy-based GC.
Hi Kris,
Thanks again for looking into this , we found this from an edge case from one of our customers & in load testing this popped up. We currently do cache the env references on each process so that should keep this exact scenario from happening. The only time it happens is on mass table create/drop like from a script, but it's obviously not something anyone would do in production. My main concern was if this was indicative of a lower level issue, but it sounds like we are solid. I will continue to keep an eye on this & if I can point to something more specific I will let you know.
Is it possible to reproduce this in C? If yes, then this should be reported against upstream LMDB.
@Venemo I haven't written C in a couple decades, if you have any guidance that would be helpful.
Well, if you have a minimal example in JavaScript that reproduces the issue, then it should be super straightforward to translate that into C.
@Venemo I admit I was being lazy :) I'll write up a quick C program and will let you all know what the results are.
@kylebernhardy Let us know if you need any help with the C. I think upstream would be interested in hearing about this, if it's not a Node specific issue.